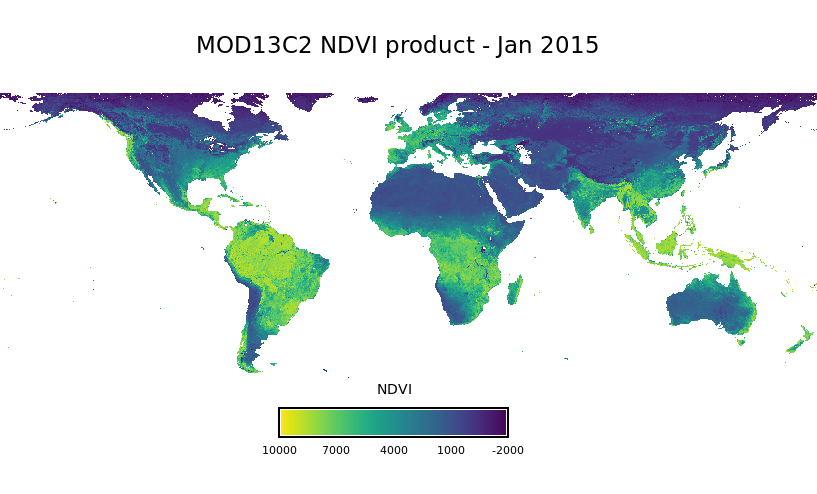
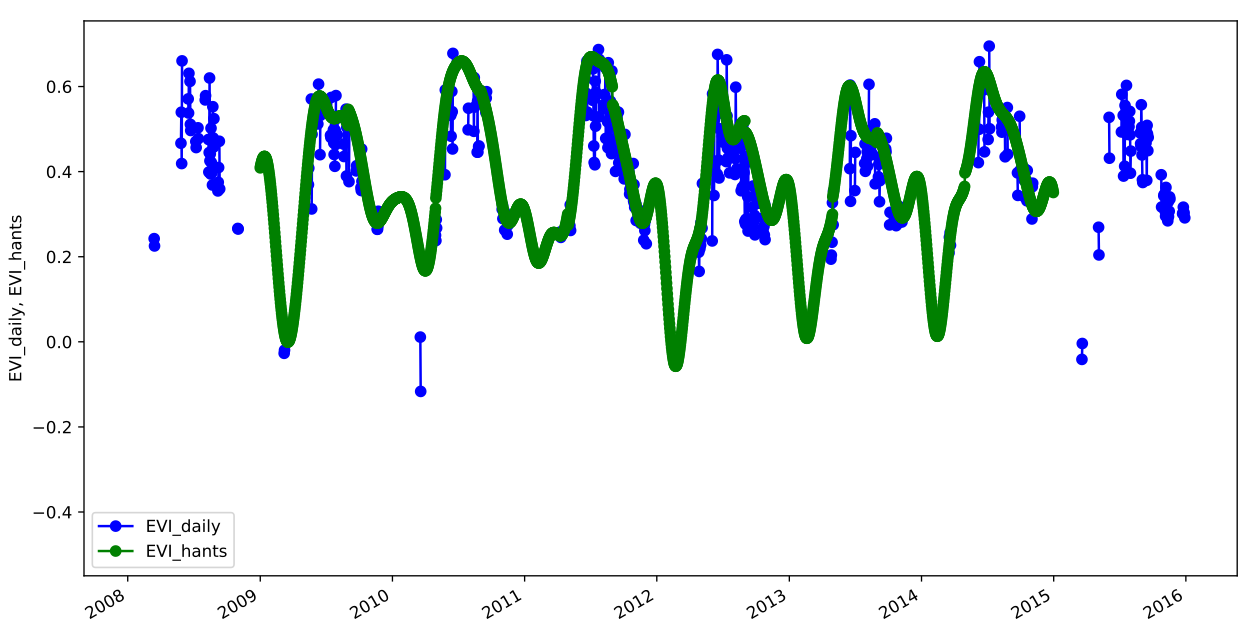
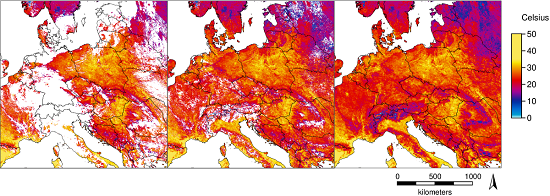
Definimos las rutas y el mapset modis_ndvi donde vamos a trabajar.
import os# data directoryhomedir ="/content/drive/MyDrive/curso_grass_2023"# change to homedir so output files will be saved thereos.chdir(homedir)# GRASS GIS database variablesgrassdata = os.path.join(homedir, "grassdata")project ="posgar2007_4_cba"mapset ="modis_ndvi"
# import standard Python packages we needimport sysimport subprocess# ask GRASS GIS where its Python packages are to be able to run it from the notebooksys.path.append( subprocess.check_output(["grass", "--config", "python_path"], text=True).strip())
Importamos los paquetes de GRASS e iniciamos una sesión.
# import the GRASS GIS packages we needimport grass.script as gsimport grass.jupyter as gj# Start the GRASS GIS Sessionsession = gj.init(grassdata, project, mapset)
# show current GRASS GIS settings, this also checks if the session worksgs.gisenv()
Exploramos los datos de NDVI
Listar los mapas y obtener información de alguno de ellos
# list raster fileslista_mapas = gs.list_grouped(type="raster")["modis_ndvi"]lista_mapas[:10]
# get info and statsgs.raster_info(map="MOD13C2.A2015001.006.single_Monthly_NDVI")
Ahora hacemos lo mismo para todos los mapas de NDVI.
# list of mapsPR = gs.list_grouped(type="raster", pattern="*_pixel_reliability")["modis_ndvi"]NDVI = gs.list_grouped(type="raster", pattern="*_Monthly_NDVI")["modis_ndvi"]# iterate over the 2 arraysfor i,j inzip(PR,NDVI):print(i, j) gs.mapcalc(exp=f"{j}_filt = if({i} != 0, null(), {j})")
Nota
Cómo podrían hacer lo mismo pero usando módulos temporales? Qué les parece t.rast.algebra? OJO! Esto requiere primero crear las series de tiempo y registrar los mapas para que funcione!
# apply pixel reliability band with t.rast.algebraexpression="NDVI_monthly_filt = if(pixel_rel_monthly != 0, null(), ndvi_monthly)"gs.run_command("t.rast.algebra", expression=expression, basename="ndvi_monthly", suffix="gran", nproc=4)
Tarea
Comparar las estadísticas entre los mapas de NDVI originales y filtrados para la misma fecha
# print time series infoprint(gs.read_command("t.info", input="ndvi_monthly"))
Imprimir la lista de mapas en la STRDS
# print list of maps in time seriesprint(gs.read_command("t.rast.list", input="ndvi_monthly"))
También podemos obtener los valores para un único pixel o para un vector de puntos. Para eso usamos t.rast.what.
# Get region center coordinates for query
gs.region(complete=True)
# Query map at center coordinatesgs.read_command("t.rast.what", strds="ndvi_monthly", coordinates="4426800,6428800", layout="col", flags="n", output="ts.csv", separator="comma", null_value=" ")
Tarea
Explorar visualmente los valores de las series temporales en diferentes puntos. Usar g.gui.tplot y seleccionar diferentes puntos interactivamente.
import pandas as pd# abrir archivo ts.csv como DataFramedf = pd.read_csv('ts.csv')# crear columna data y llenarla con el anio y mes de la columna startdf['date'] = df['start'].str.extract('(^[0-9]*-[0-9]*)')# eliminar Nandf = df.dropna()# cambiar nombre de la columnadf.rename(columns = {'4426800.0000000000;6428800.0000000000':'NDVI'}, inplace =True)
# crear gráficoimport matplotlib.pyplot as pltplt.figure(figsize=(15, 7))plt.plot(df['date'],df['NDVI'])plt.xticks(rotation =90) plt.show();
Datos faltantes
Obtener las estadísticas de la serie de tiempo
# How much missing data we have after filtering for pixel reliability?print(gs.read_command("t.rast.univar",input="ndvi_monthly"))
# list filled mapsgs.list_grouped(type="raster", pattern="*hants")["modis_ndvi"]
Tarea
Probar diferentes ajustes de parámetros en r.hants y comparar los resultados
Parcheamos un mapa de la serie original y con el reconstruido
# patch original with filled (one map)NDVI_ORIG ="MOD13C2.A2015001.006.single_Monthly_NDVI_filt"NDVI_HANTS ="MOD13C2.A2015001.006.single_Monthly_NDVI_filt_hants"gs.run_command("r.patch",input=[NDVI_ORIG, NDVI_HANTS], output=f"{NDVI_HANTS}_patch")
Ahora parcheamos todos los mapas de la serie original y reconstruida
# list of mapsORIG = gs.list_grouped(type="raster", pattern="*_filt")["modis_ndvi"]FILL = gs.list_grouped(type="raster", pattern="*_hants")["modis_ndvi"]
Qué otros algoritmos existen o qué otra aproximación podría seguirse?
Agregación con granularidad
Tarea
Obtener el promedio de NDVI cada dos meses
Visualizar la serie de tiempo resultante con TimeSeriesMap
Indicadores de fenología
Fecha de ocurrencia de máximos y mínimos
Identificamos primero los máximos y mínimos de la serie, luego reemplazamos con start_month() los valores en la STRDS si coinciden con el mínimo o máximo global y finalmente obtenemos el primer mes en el que aparecieron el máximo y el mínimo.
methods = ["maximum","minimum"]for me in methods:# get maximum and minimum gs.run_command("t.rast.series",input="ndvi_monthly_patch", method=me, output=f"ndvi_{me}")# get month of maximum and minimum gs.run_command("t.rast.mapcalc", inputs="ndvi_monthly_patch", output=f"month_{me}_ndvi", expression=f"if(ndvi_monthly_patch == ndvi_{me}, start_month(), null())", basename=f"month_{me}_ndvi")# get the earliest month in which the maximum and minimum appeared gs.run_command("t.rast.series",input=f"month_{me}_ndvi", method="minimum", output=f"earliest_month_{me}_ndvi")# remove intermediate strds gs.run_command("t.remove", flags="rfd", inputs=f"month_{me}_ndvi")
Tarea
Mostrar los mapas resultantes con InteractiveMap
Cuándo se observan los mínimos y máximos? Hay algun patrón? A qué se podría deber?
Tarea
Asociar el máximo de LST con el máximo de NDVI y, la fecha de la máxima LST con la fecha del máximo NDVI
Agregar el mapset modis_lst a los mapsets accesibles.
Obtener series temporales de pendientes entre mapas consecutivos
# time series of slopesexpression ="slope_ndvi = (ndvi_monthly_patch[1] - ndvi_monthly_patch[0]) / td(ndvi_monthly_patch)"gs.run_command("t.rast.algebra", expression=expression, basename="slope_ndvi", suffix="gran")
Obtener la máxima pendiente por año
# get max slope per yeargs.run_command("t.rast.aggregate",input="slope_ndvi", output="ndvi_slope_yearly", basename="NDVI_max_slope_year", suffix="gran", method="maximum", granularity="1 years")
Tarea
Obtener un mapa con la mayor tasa de crecimiento por píxel en el período 2015-2019
Determinar el comienzo, el final y la duración del período de crecimiento
# start, end and length of growing seasongs.run_command("r.seasons",input=patched_maps, prefix="ndvi_season", n=3, nout="ndvi_season", threshold_value=3000, min_length=5)
Tarea
Qué nos dice cada mapa? Dónde es más larga la estación de crecimiento?
Exportar los mapas resultantes como .png
Crear un mapa de umbrales para usar en r.seasons
# create a threshold map: min ndvi + 0.1*ndvigs.mapcalc(exp="threshold_ndvi = ndvi_minimum * 1.1")
Tarea
Utilizar el mapa de umbrales en r.seasons y comparar los mapas de salida con los resultados de utilizar sólo un valor de umbral.
Asignamos semantic labels correspondientes a las bandas
# asign semantic labels to NIR and MIR mapsfor i in list_nir: gs.run_command("r.support",map=i, semantic_label="nir")for i in list_mir: gs.run_command("r.support",map=i, semantic_label="mir")
# create time series of NIR and MIR altogethergs.run_command("t.create", output="modis_surf",type="strds", temporaltype="absolute", title="Monthly surface reflectance, NIR and MIR", description="NIR and MIR monthly - MOD13C2 - 2015-2019")
Metz, M., Andreo, V., y Neteler, M. (2017), «A NewFullyGap-FreeTimeSeries of LandSurfaceTemperature from MODISLSTData», Remote Sensing, 9, 1333. https://doi.org/10.3390/rs9121333.
Ejecutar el código
---title: 'Ejercicio: Series temporales en GRASS GIS'author: Verónica Andreodate: todayformat: html: code-tools: true code-copy: true code-fold: falseexecute: eval: false cache: false keep-ipynb: truejupyter: python3---En esta notebook vamos a recorrer algunas de las funcionalidades de TGRASSque ya vimos y otras nuevas, pero ahora con una serie de datos de NDVI.Antes de empezar y para ganar tiempo, conectamos nuestro drive e instalamos GRASS en Google Colab.```{python}# import drive from google colabfrom google.colab import drive# mount drivedrive.mount("/content/drive")``````{python}%%bashDEBIAN_FRONTEND=noninteractive sudo add-apt-repository ppa:ubuntugis/ubuntugis-unstable apt update apt install grass subversion grass-devapt remove libproj22``````{python}!grass --config path```## Datos para el ejercicio- Producto MODIS: <ahref="https://lpdaac.usgs.gov/products/mod13c2v006/">MOD13C2 Collection 6</a>- Composiciones globales mensuales- Período: Enero 2015 - Diciembre 2019- Resolución espacial: 5600 m- Mapset `modis_ndvi`{width=70%}## Iniciamos GRASSDefinimos las rutas y el mapset *`modis_ndvi`* donde vamos a trabajar.```{python}import os# data directoryhomedir ="/content/drive/MyDrive/curso_grass_2023"# change to homedir so output files will be saved thereos.chdir(homedir)# GRASS GIS database variablesgrassdata = os.path.join(homedir, "grassdata")project ="posgar2007_4_cba"mapset ="modis_ndvi"``````{python}# import standard Python packages we needimport sysimport subprocess# ask GRASS GIS where its Python packages are to be able to run it from the notebooksys.path.append( subprocess.check_output(["grass", "--config", "python_path"], text=True).strip())```Importamos los paquetes de GRASS e iniciamos una sesión.```{python}# import the GRASS GIS packages we needimport grass.script as gsimport grass.jupyter as gj# Start the GRASS GIS Sessionsession = gj.init(grassdata, project, mapset)``````{python}# show current GRASS GIS settings, this also checks if the session worksgs.gisenv()```## Exploramos los datos de NDVIListar los mapas y obtener información de alguno de ellos```{python}# list raster fileslista_mapas = gs.list_grouped(type="raster")["modis_ndvi"]lista_mapas[:10]``````{python}# get info and statsgs.raster_info(map="MOD13C2.A2015001.006.single_Monthly_NDVI")``````{python}print(gs.read_command("r.univar",map="MOD13C2.A2015001.006.single_Monthly_NDVI"))```:::{.callout-warning title="Tarea"}- Mostrar los mapas de NDVI, NIR y pixel reliability.- Obtener información sobre los valores mínimos y máximos.- ¿Qué se puede decir sobre los valores de cada banda?- ¿Hay valores nulos?:::## Uso de la banda de confiabilidadDefinir la región computacional```{python}# set computational regionprint(gs.read_command("g.region", vector="provincia_cba", align="MOD13C2.A2015001.006.single_Monthly_NDVI", flags="p"))```Establecer los límites provinciales como máscara```{python}# set a MASK to Cba boundarygs.run_command("r.mask", vector="provincia_cba")```:::{.callout-warning title="Tarea"}- Leer acerca de la banda de confiabilidad en la [Guía de usuario](https://lpdaac.usgs.gov/documents/103/MOD13_User_Guide_V6.pdf) de MOD13 (pag 27).- Para una misma fecha mapear la banda de confiabilidad y el NDVI.- Seleccionar sólo los pixeles con valor 0 (Buena calidad) en la banda de confiabilidad. ¿Qué se observa?:::Vamos a mantener sólo los pixeles de la mejor calidad para un mapa.```{python}# keep only NDVI most reliable pixels (one map)PR="MOD13C2.A2015274.006.single_Monthly_pixel_reliability"NDVI="MOD13C2.A2015274.006.single_Monthly_NDVI"gs.mapcalc(exp=f"{NDVI}_filt = if({PR} != 0, null(), {NDVI})")``````{python}# plot resultndvi_filt = gj.InteractiveMap(width =500, tiles="OpenStreetMap")ndvi_filt.add_raster("MOD13C2.A2015274.006.single_Monthly_NDVI_filt")ndvi_filt.show()```Ahora hacemos lo mismo para todos los mapas de NDVI.```{python}# list of mapsPR = gs.list_grouped(type="raster", pattern="*_pixel_reliability")["modis_ndvi"]NDVI = gs.list_grouped(type="raster", pattern="*_Monthly_NDVI")["modis_ndvi"]# iterate over the 2 arraysfor i,j inzip(PR,NDVI):print(i, j) gs.mapcalc(exp=f"{j}_filt = if({i} != 0, null(), {j})")```:::{.callout-note}Cómo podrían hacer lo mismo pero usando módulos temporales? Qué les parece [t.rast.algebra](https://grass.osgeo.org/grass-stable/manuals/t.rast.algebra.html)? OJO! Esto requiere primero crear las series de tiempo y registrar los mapas para que funcione!```{python}# apply pixel reliability band with t.rast.algebraexpression="NDVI_monthly_filt = if(pixel_rel_monthly != 0, null(), ndvi_monthly)"gs.run_command("t.rast.algebra", expression=expression, basename="ndvi_monthly", suffix="gran", nproc=4)```::::::{.callout-warning title="Tarea"}Comparar las estadísticas entre los mapas de NDVI originales y filtrados para la misma fecha:::## Creación de la serie de tiempoCrear STRDS de NDVI```{python}# create STRDSgs.run_command("t.create",type="strds", temporaltype="absolute", output="ndvi_monthly", title="Filtered monthly NDVI", description="Filtered monthly NDVI - MOD13C2 - Cordoba, 2015-2019")```Corroborar que la STRDS fue creada```{python}# check if it was createdgs.read_command("t.list",type="strds")```Creamos la lista de mapas```{python}# list NDVI filtered filesNDVI_filt = gs.list_grouped(type="raster", pattern="*_filt")["modis_ndvi"]NDVI_filt[:10]```Asignar fecha a los mapas, i.e., registrar```{python}# register mapsgs.run_command("t.register",input="ndvi_monthly", maps=NDVI_filt, start="2015-01-01", increment="1 months", flags="i")```Imprimir info básica de la STRDS```{python}# print time series infoprint(gs.read_command("t.info", input="ndvi_monthly"))```Imprimir la lista de mapas en la STRDS```{python}# print list of maps in time seriesprint(gs.read_command("t.rast.list", input="ndvi_monthly"))```También podemos obtener los valores para un único pixel o para un vector de puntos. Para esousamos [t.rast.what](https://grass.osgeo.org/grass-stable/manuals/t.rast.what.html).```{python}# Get region center coordinates for query gs.region(complete=True)``````{python}# Query map at center coordinatesgs.read_command("t.rast.what", strds="ndvi_monthly", coordinates="4426800,6428800", layout="col", flags="n", output="ts.csv", separator="comma", null_value=" ")```:::{.callout-warning title="Tarea"}Explorar visualmente los valores de las series temporales en diferentes puntos. Usar [g.gui.tplot](https://grass.osgeo.org/grass-stable/manuals/g.gui.tplot.html) y seleccionar diferentes puntos interactivamente.:::```{python}import pandas as pd# abrir archivo ts.csv como DataFramedf = pd.read_csv('ts.csv')# crear columna data y llenarla con el anio y mes de la columna startdf['date'] = df['start'].str.extract('(^[0-9]*-[0-9]*)')# eliminar Nandf = df.dropna()# cambiar nombre de la columnadf.rename(columns = {'4426800.0000000000;6428800.0000000000':'NDVI'}, inplace =True)``````{python}# crear gráficoimport matplotlib.pyplot as pltplt.figure(figsize=(15, 7))plt.plot(df['date'],df['NDVI'])plt.xticks(rotation =90) plt.show();```## Datos faltantesObtener las estadísticas de la serie de tiempo```{python}# How much missing data we have after filtering for pixel reliability?print(gs.read_command("t.rast.univar",input="ndvi_monthly"))```Contar los datos válidos```{python}# count valid datags.run_command("t.rast.series",input="ndvi_monthly", method="count", output="ndvi_count_valid")```Estimar el porcentaje de datos faltantes```{python}# estimate percentage of missing datags.mapcalc(exp="ndvi_missing = ((60 - ndvi_count_valid) * 100.0)/60")```Cómo guardar en una variable el numero de mapas de una serie de tiempo?```{python}n = gs.parse_command("t.info", input="ndvi_monthly", flags="g")["number_of_maps"]n``````{python}gs.mapcalc(exp=f"ndvi_missing = (({n} - ndvi_count_valid) * 100.0)/{n}")```:::{.callout-warning title="Tarea"}- Mostrar el mapa que representa el porcentaje de datos faltantes. - Obtener estadísticas univariadas de este mapa.- Dónde estan los mayores porcentajes de datos faltantes? Por qué creen que puede ser?:::## Reconstrucción temporal: HANTS- Harmonic Analysis of Time Series (HANTS)- Implementado en la extensión [r.hants](https://grass.osgeo.org/grass-stable/manuals/addons/r.hants.html){width="65%"}Instalar la extensión *r.hants*```{python}# install extensiongs.run_command("g.extension", extension="r.hants")```Listar los mapas y aplicar r.hants```{python}# list mapsmaplist = gs.parse_command("t.rast.list",input="ndvi_monthly", columns="name", method="comma", flags="u")maplist =list(maplist.keys())``````{python}# gapfill: r.hantsgs.run_command("r.hants",input=maplist,range=[-2000,10000], nf=5, fet=500, base_period=12)``````{python}# list filled mapsgs.list_grouped(type="raster", pattern="*hants")["modis_ndvi"]```:::{.callout-warning title="Tarea"}Probar diferentes ajustes de parámetros en[r.hants](https://grass.osgeo.org/grass-stable/manuals/addons/r.hants.html) y comparar los resultados:::Parcheamos un mapa de la serie original y con el reconstruido```{python}# patch original with filled (one map)NDVI_ORIG ="MOD13C2.A2015001.006.single_Monthly_NDVI_filt"NDVI_HANTS ="MOD13C2.A2015001.006.single_Monthly_NDVI_filt_hants"gs.run_command("r.patch",input=[NDVI_ORIG, NDVI_HANTS], output=f"{NDVI_HANTS}_patch")```Ahora parcheamos todos los mapas de la serie original y reconstruida```{python}# list of mapsORIG = gs.list_grouped(type="raster", pattern="*_filt")["modis_ndvi"]FILL = gs.list_grouped(type="raster", pattern="*_hants")["modis_ndvi"]``````{python}# patchingfor i,j inzip(ORIG,FILL):print(i, j) out=f"{j}_patch" gs.run_command("r.patch",input=[i, j], output=out)```Creamos la serie de tiempo con los datos parcheados y registramos los mapas.```{python}# create new time series gs.run_command("t.create", output="ndvi_monthly_patch",type="strds", temporaltype="absolute", title="Patched monthly NDVI", description="Filtered, gap-filled and patched monthly NDVI - MOD13C2 - Cordoba, 2015-2019")``````{python}# list NDVI patched filespatched_maps = gs.list_grouped(type="raster", pattern="*patch")["modis_ndvi"]patched_maps[:5]``````{python}# register mapsgs.run_command("t.register", flags="i",input="ndvi_monthly_patch",type="raster", maps=patched_maps, start="2015-01-01", increment="1 months")```Imprimir información de la serie de tiempo```{python}# print time series infoprint(gs.read_command("t.info", input="ndvi_monthly_patch"))```:::{.callout-warning title="Tarea"}- Evaluar gráficamente los resultados de la reconstrucción de HANTS en pixeles con mayor porcentaje de datos faltantes - Obtener estadísticas univariadas para las nuevas series temporales::::::{.callout-warning title="Tarea"}- Ver la sección de métodos en @metz_new_2017 - Qué otros algoritmos existen o qué otra aproximación podría seguirse?:::## Agregación con granularidad:::{.callout-warning title="Tarea"}- Obtener el promedio de NDVI cada dos meses- Visualizar la serie de tiempo resultante con `TimeSeriesMap`:::## Indicadores de fenología### Fecha de ocurrencia de máximos y mínimosIdentificamos primero los máximos y mínimos de la serie, luego reemplazamos con `start_month()` los valores en la STRDS si coinciden con el mínimo o máximo global y finalmente obtenemos el primer mes en el que aparecieron el máximo y el mínimo.```{python}methods = ["maximum","minimum"]for me in methods:# get maximum and minimum gs.run_command("t.rast.series",input="ndvi_monthly_patch", method=me, output=f"ndvi_{me}")# get month of maximum and minimum gs.run_command("t.rast.mapcalc", inputs="ndvi_monthly_patch", output=f"month_{me}_ndvi", expression=f"if(ndvi_monthly_patch == ndvi_{me}, start_month(), null())", basename=f"month_{me}_ndvi")# get the earliest month in which the maximum and minimum appeared gs.run_command("t.rast.series",input=f"month_{me}_ndvi", method="minimum", output=f"earliest_month_{me}_ndvi")# remove intermediate strds gs.run_command("t.remove", flags="rfd", inputs=f"month_{me}_ndvi")```:::{.callout-warning title="Tarea"}- Mostrar los mapas resultantes con `InteractiveMap`- Cuándo se observan los mínimos y máximos? Hay algun patrón? A qué se podría deber?::::::{.callout-warning title="Tarea"}- Asociar el máximo de LST con el máximo de NDVI y, la fecha de la máxima LST con la fecha del máximo NDVI- Agregar el mapset `modis_lst` a los mapsets accesibles.- Ver el módulo [r.covar](https://grass.osgeo.org/grass-stable/manuals/r.covar.html).:::### Tasa de crecimientoObtener series temporales de pendientes entre mapas consecutivos```{python}# time series of slopesexpression ="slope_ndvi = (ndvi_monthly_patch[1] - ndvi_monthly_patch[0]) / td(ndvi_monthly_patch)"gs.run_command("t.rast.algebra", expression=expression, basename="slope_ndvi", suffix="gran")```Obtener la máxima pendiente por año```{python}# get max slope per yeargs.run_command("t.rast.aggregate",input="slope_ndvi", output="ndvi_slope_yearly", basename="NDVI_max_slope_year", suffix="gran", method="maximum", granularity="1 years")```:::{.callout-warning title="Tarea"}- Obtener un mapa con la mayor tasa de crecimiento por píxel en el período 2015-2019- Qué modulo usarían?:::### Período de crecimientoInstalar la extensión *r.seasons*```{python}# install extensiongs.run_command("g.extension", extension="r.seasons")```Determinar el comienzo, el final y la duración del período de crecimiento```{python}# start, end and length of growing seasongs.run_command("r.seasons",input=patched_maps, prefix="ndvi_season", n=3, nout="ndvi_season", threshold_value=3000, min_length=5)```:::{.callout-warning title="Tarea"}- Qué nos dice cada mapa? Dónde es más larga la estación de crecimiento?- Exportar los mapas resultantes como .png:::Crear un mapa de umbrales para usar en *r.seasons*```{python}# create a threshold map: min ndvi + 0.1*ndvigs.mapcalc(exp="threshold_ndvi = ndvi_minimum * 1.1")```:::{.callout-warning title="Tarea"}Utilizar el mapa de umbrales en [r.seasons](https://grass.osgeo.org/grass-stable/manuals/addons/r.seasons.html) y comparar los mapas de salida con los resultados de utilizar sólo un valor de umbral.:::## Serie de tiempo de NDWIListas de mapas de reflectancia```{python}list_nir = gs.list_grouped(type="raster", pattern="*NIR*")["modis_ndvi"]list_mir = gs.list_grouped(type="raster", pattern="*MIR*")["modis_ndvi"]len(list_nir,list_mir)```Asignamos *semantic labels* correspondientes a las bandas```{python}# asign semantic labels to NIR and MIR mapsfor i in list_nir: gs.run_command("r.support",map=i, semantic_label="nir")for i in list_mir: gs.run_command("r.support",map=i, semantic_label="mir")``````{python}# checkgs.raster_info("MOD13C2.A2015001.006.single_Monthly_MIR_reflectance")["semantic_label"]```Crear series temporales de NIR y MIR```{python}# create time series of NIR and MIR altogethergs.run_command("t.create", output="modis_surf",type="strds", temporaltype="absolute", title="Monthly surface reflectance, NIR and MIR", description="NIR and MIR monthly - MOD13C2 - 2015-2019")```Registrar mapas```{python}# register mapsgs.run_command("t.register",input="modis_surf", maps=list_nir, start="2015-01-01", increment="1 months", flags="i")gs.run_command("t.register",input="modis_surf", maps=list_mir, start="2015-01-01", increment="1 months", flags="i")```Imprimir información de la serie de tiempo```{python}# print time series infoprint(gs.read_command("t.info", input="modis_surf"))``````{python}# List only NIR mapsprint(gs.read_command("t.rast.list", input="modis_surf.nir", columns="name,semantic_label"))```Estimación de la serie temporal de NDWI```{python}# extract nir and mir strdssls = ["nir", "mir"]for sl in sls: gs.run_command("t.rast.extract",input="modis_surf", where=f"semantic_label == '{sl}'", output=sl)``````{python}# estimate NDWI time seriesexpression="ndwi_monthly = if(nir > 0 && mir > 0, (float(nir - mir) / float(nir + mir)), null())"gs.run_command("t.rast.algebra", basename="ndwi_monthly", expression=expression, suffix="gran", flags="n")``````{python}# estimate NDWI time series#gs.run_command("t.rast.mapcalc", # inputs="modis_surf.mir,modis_surf.nir", # output="ndwi_monthly", # basename="ndwi",# expression="float(modis_surf.nir - modis_surf.mir) / (modis_surf.nir + modis_surf.mir)")``````{python}gs.run_command("t.rast.colors", input="ndwi_monthly", color="ndwi")``````{python}print(gs.read_command("t.info", input="ndwi_monthly"))```:::{.callout-warning title="Tarea"}Obtener valores máximos y mínimos para cada mapa de NDWI y explorar el trazado de la serie de tiempo en diferentes puntos de forma interactivaVer el manual de [t.rast.univar](https://grass.osgeo.org/grass-stable/manuals/t.rast.univar.html):::### Frecuencia de inundaciónReclasificar los mapas según un umbral```{python}# reclassifygs.run_command("t.rast.mapcalc",input="ndwi_monthly", output="flood", basename="flood", expression="if(ndwi_monthly > 0.8, 1, null())", flags="n")```Obtener frecuencia de inundación```{python}# flooding frequencygs.run_command("t.rast.series",input="flood", output="flood_freq", method="sum")```:::{.callout-warning title="Tarea"}Cuáles son las áreas que se han inundado con más frecuencia?:::## Regresión NDVI-NDWIInstalar la extensión *r.regression.series*```{python}# install extensiongs.run_command("g.extension", extension="r.regression.series")```Realizar una regresión entre las series temporales de NDVI y NDWI```{python}xseries = patched_mapsyseries = gs.list_grouped(type="raster", pattern="ndwi_monthly*")["modis_ndvi"]gs.run_command("r.regression.series", xseries=xseries, yseries=yseries, output="ndvi_ndwi_rsq", method="rsq")``````{python}rsq = gj.InteractiveMap(width =400, use_region=True)rsq.add_raster("ndvi_ndwi_rsq", opacity=0.8)rsq.add_layer_control(position ="bottomright")rsq.show()```:::{.callout-warning title="Tarea"}Determinar dónde está la mayor correlación entre NDVI y NDWI:::## Recursos (muy) útiles - [Temporal data processing wiki](https://grasswiki.osgeo.org/wiki/Temporal_data_processing)- [GRASS GIS and R for time series processing wiki](https://grasswiki.osgeo.org/wiki/Temporal_data_processing/GRASS_R_raster_time_series_processing)- [GRASS GIS temporal workshop at NCSU](http://ncsu-geoforall-lab.github.io/grass-temporal-workshop/)- [GRASS GIS course IRSAE 2018](http://training.gismentors.eu/grass-gis-irsae-winter-course-2018/index.html)- [GRASS GIS workshop held in Jena 2023](https://training.gismentors.eu/grass-gis-workshop-jena/)- [Using Satellite Data for Species Distribution Modeling with GRASS GIS and R](https://veroandreo.github.io/grass_ncsu_2023/studio_index.html). Workshop en NCSU. Abril, 2023.## Referencias::: {#refs .tiny}:::