Status of GRASS GIS project
Veronica Andreo and the GRASS GIS community
NCSU GeoForAll Lab
at the
Center for Geospatial Analytics
NC State University
FOSS4G Europe, Tartu, July 1-7, 2024
Veronica (Vero) Andreo
- Visiting scholar at NC State's Center for Geospatial Analytics
- Lic. & PhD in Biology, MSc in Applications of the Spatial Information
- Researcher & lecturer at Gulich Institute
- GRASS GIS: Development Team, PSC chair
- OSGeo: Charter member

Overview
- What is GRASS GIS?
- Releases
- New features in GRASS GIS 8.4+
- New extensions
- Code quality and security
- Distribution
- Mentoring
- Community
- Governance
- Get involved!
What is GRASS GIS?
What is GRASS GIS?
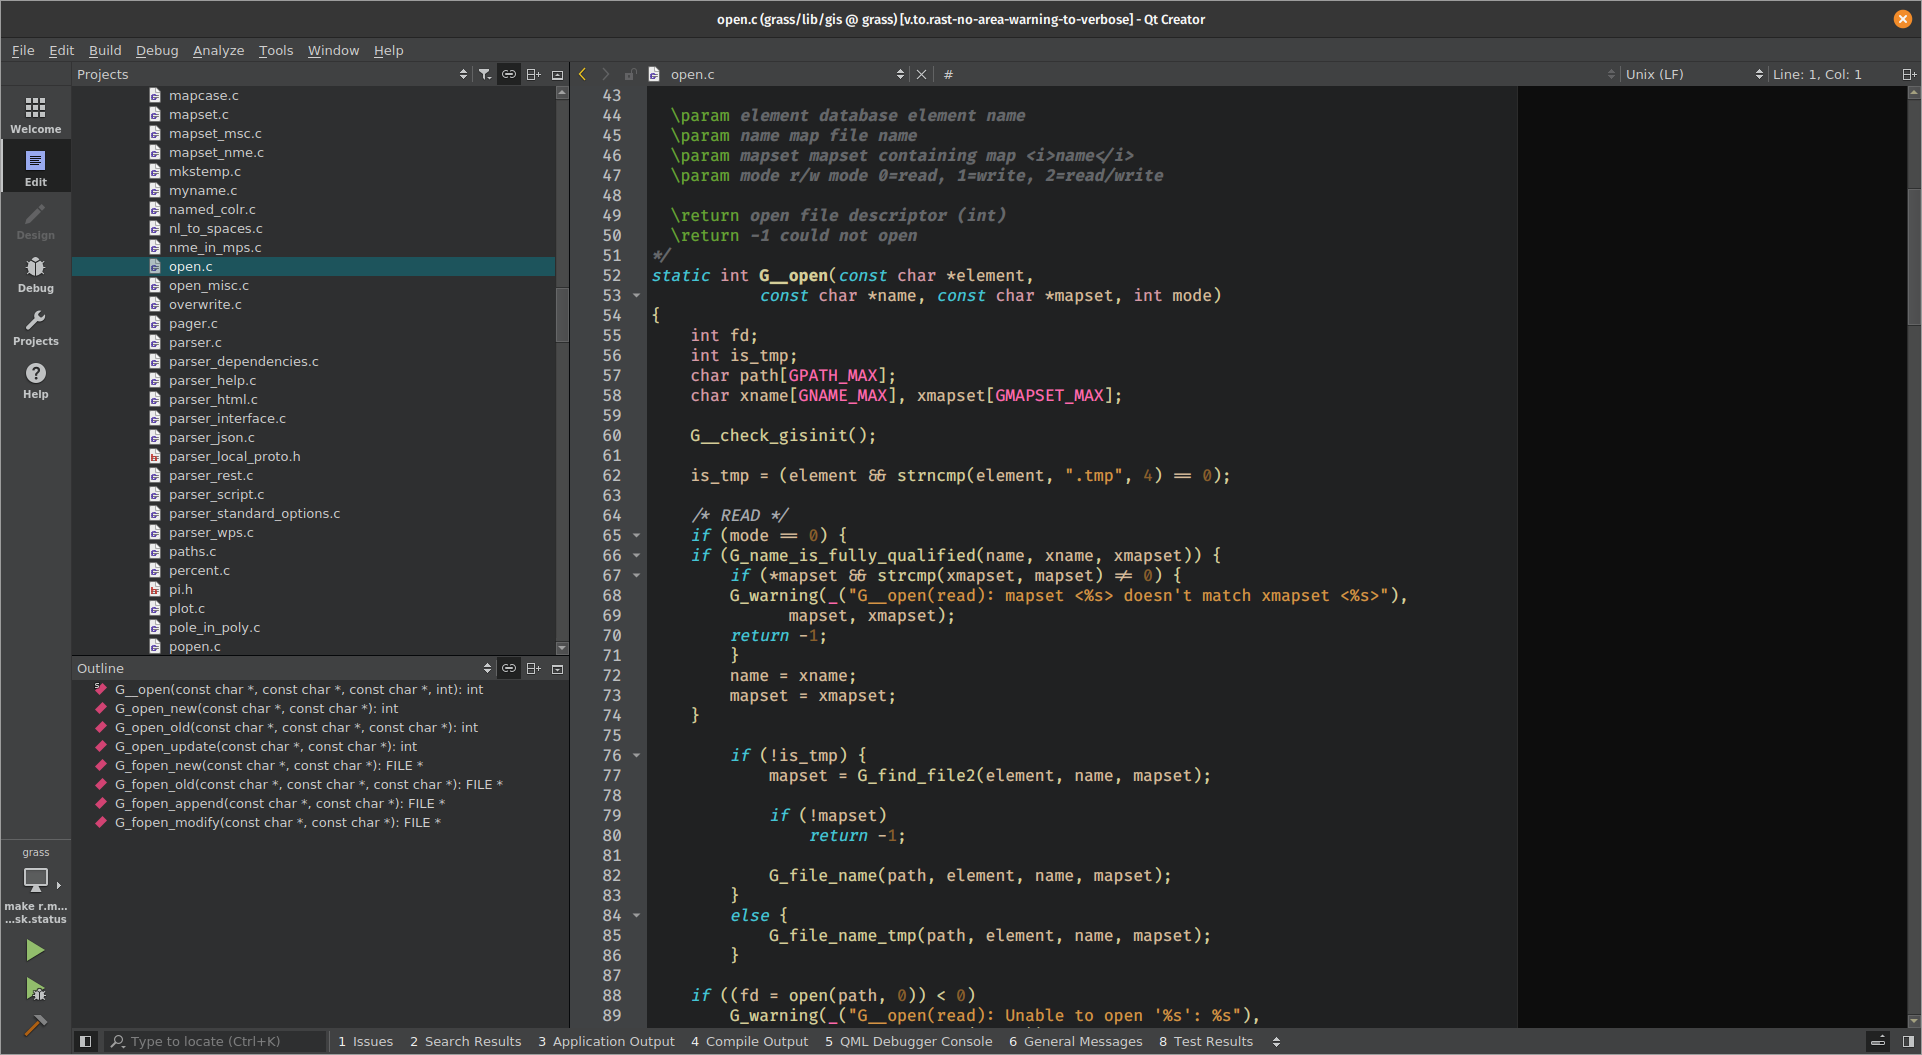
Geek open-source command line GIS
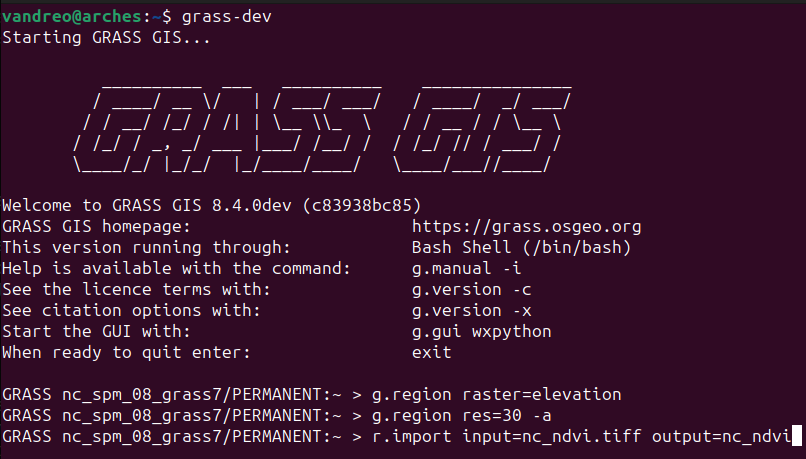
What is GRASS GIS?
Open-source desktop GIS
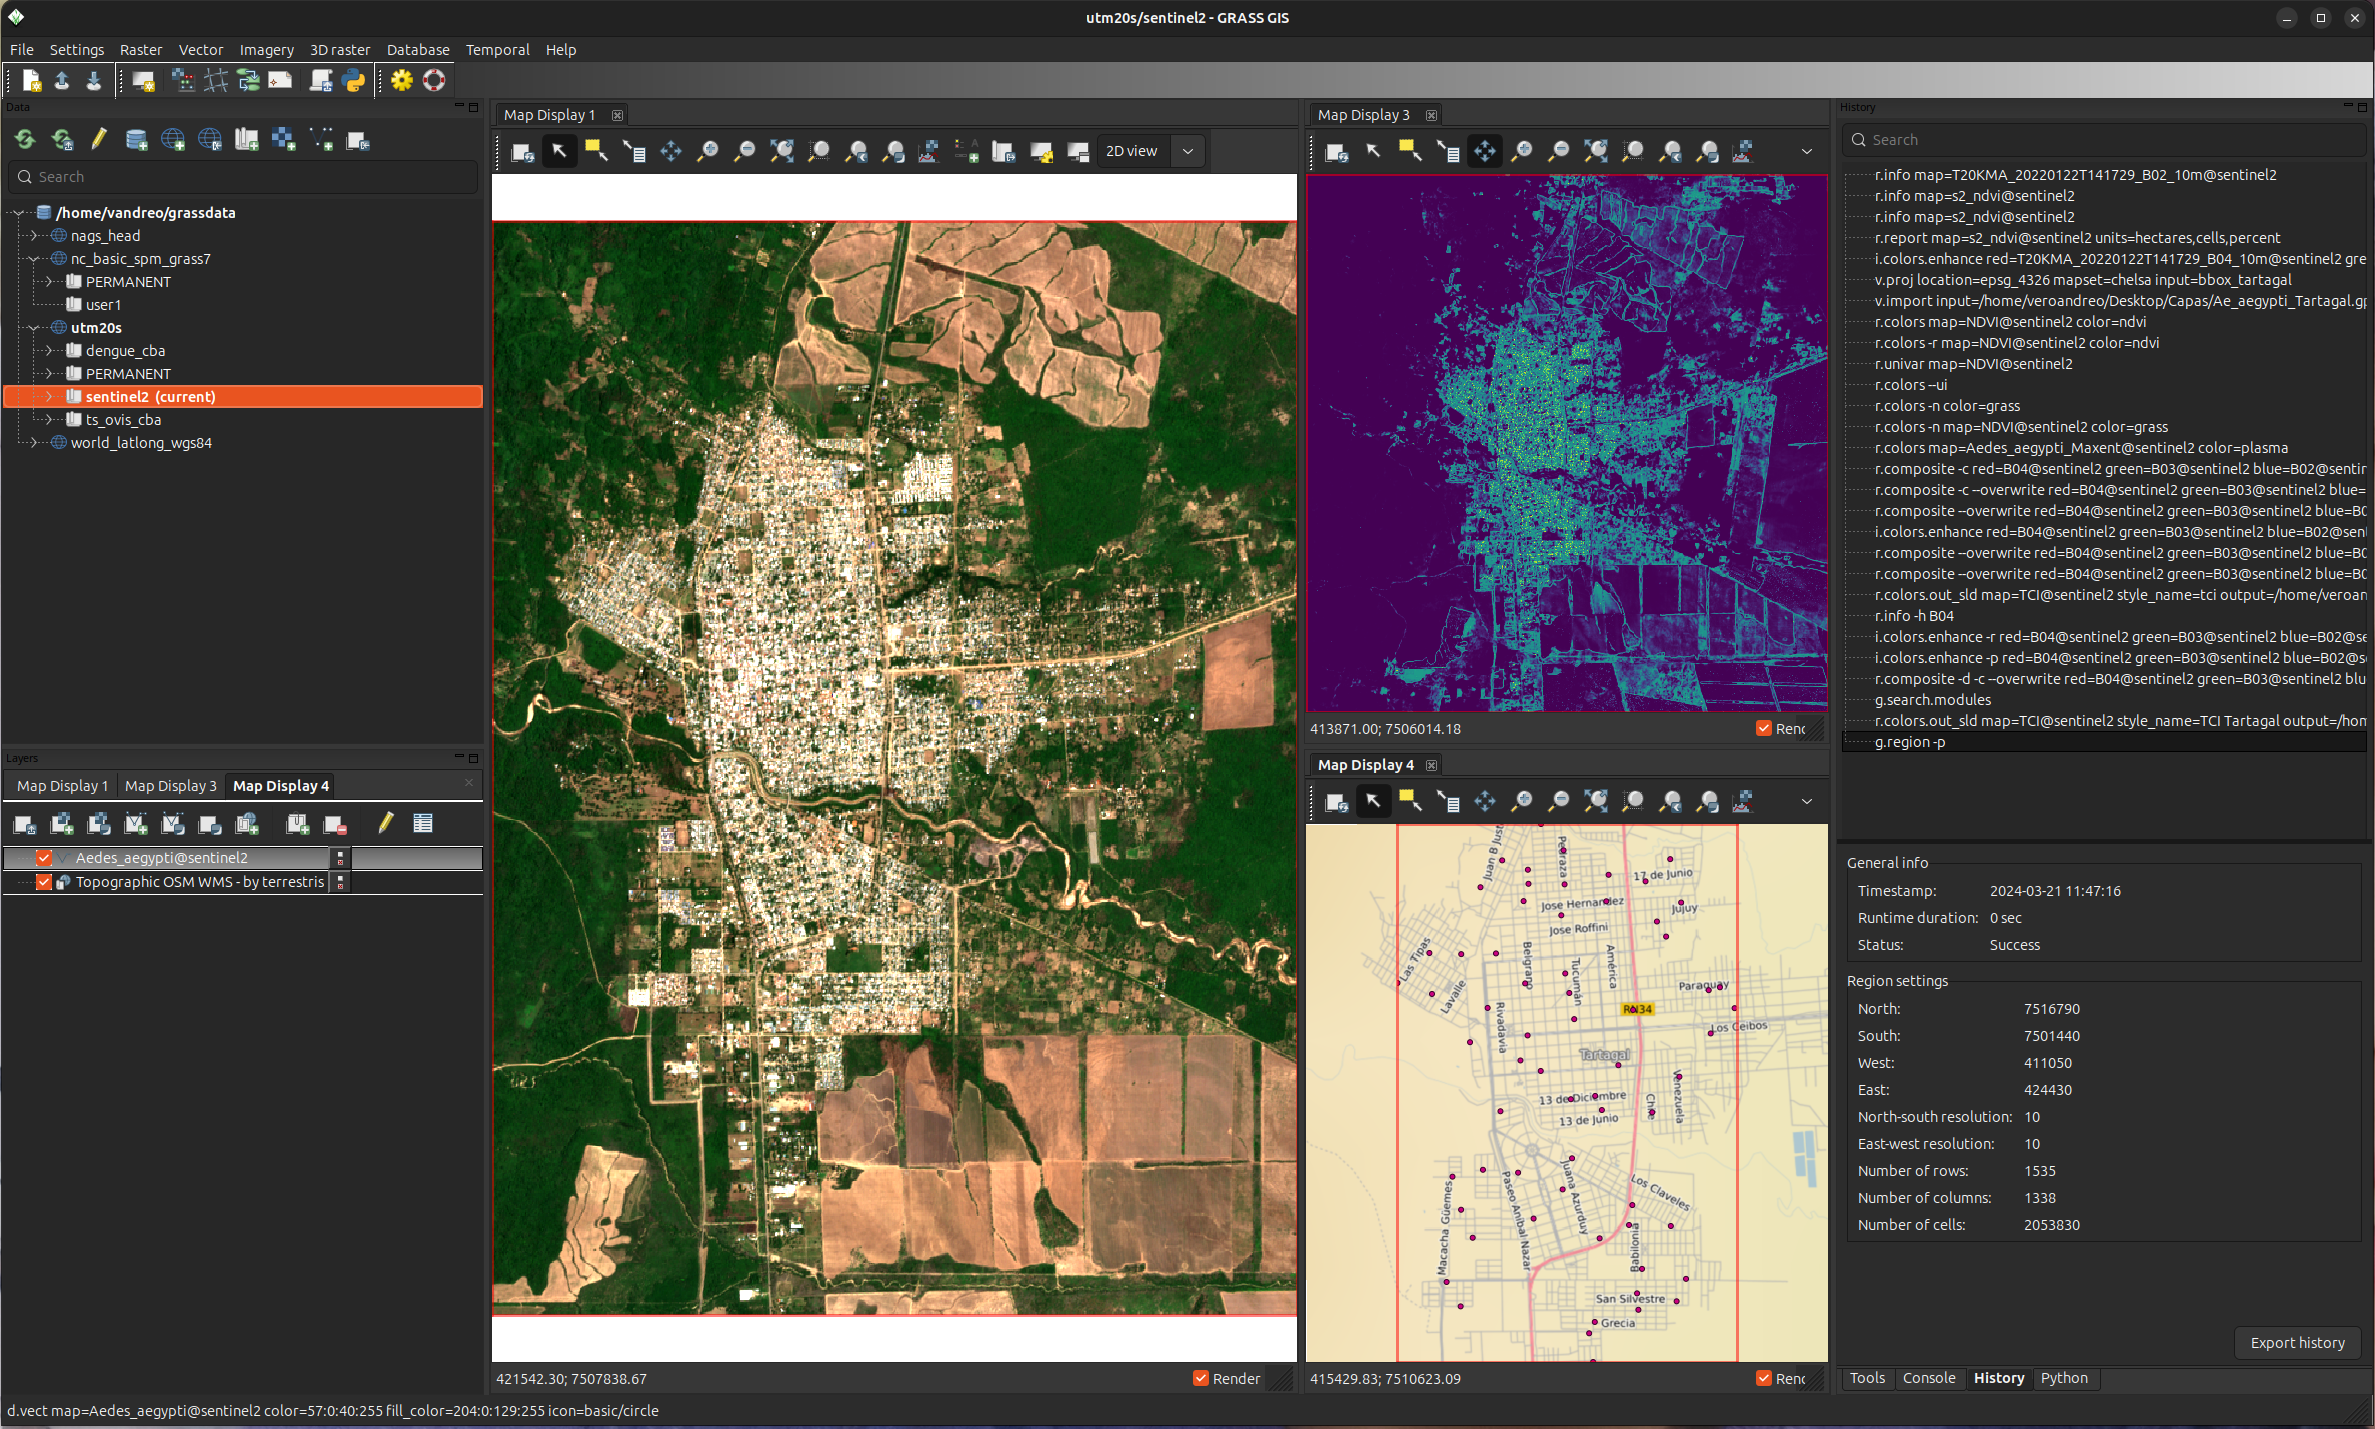
What is GRASS GIS?
Processing backend in QGIS
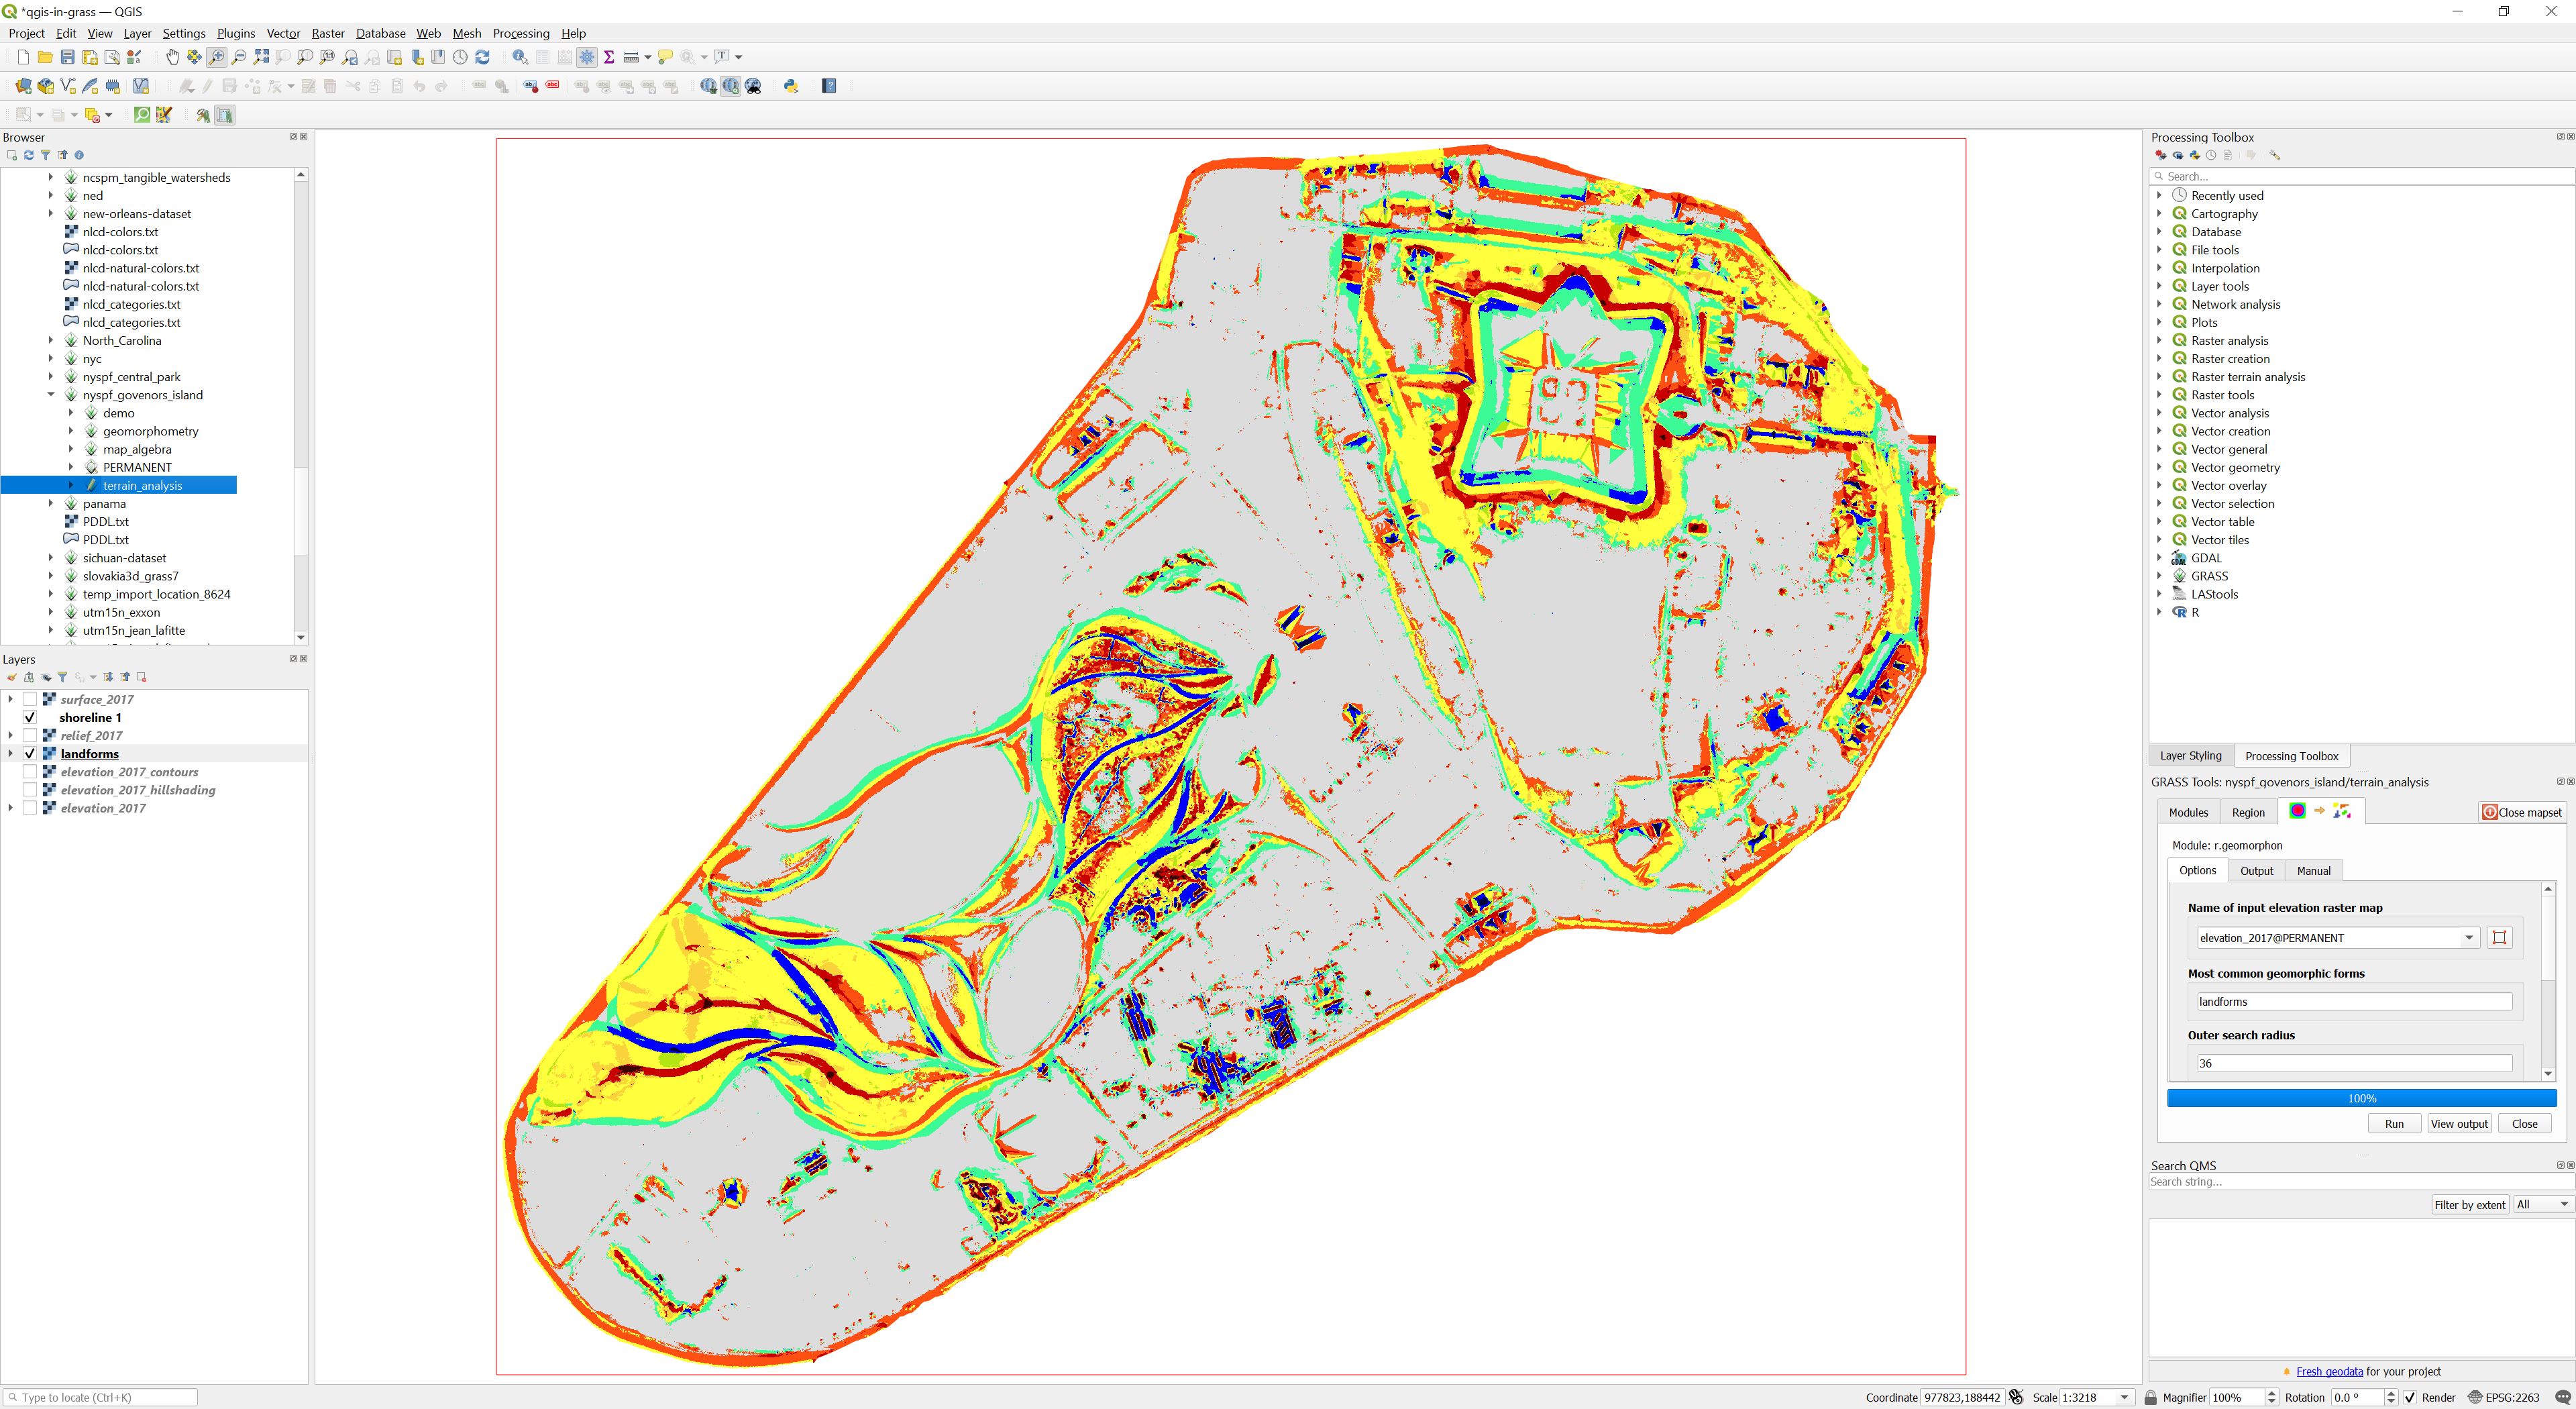 Image source: baharmon.github.io/grass-in-qgis
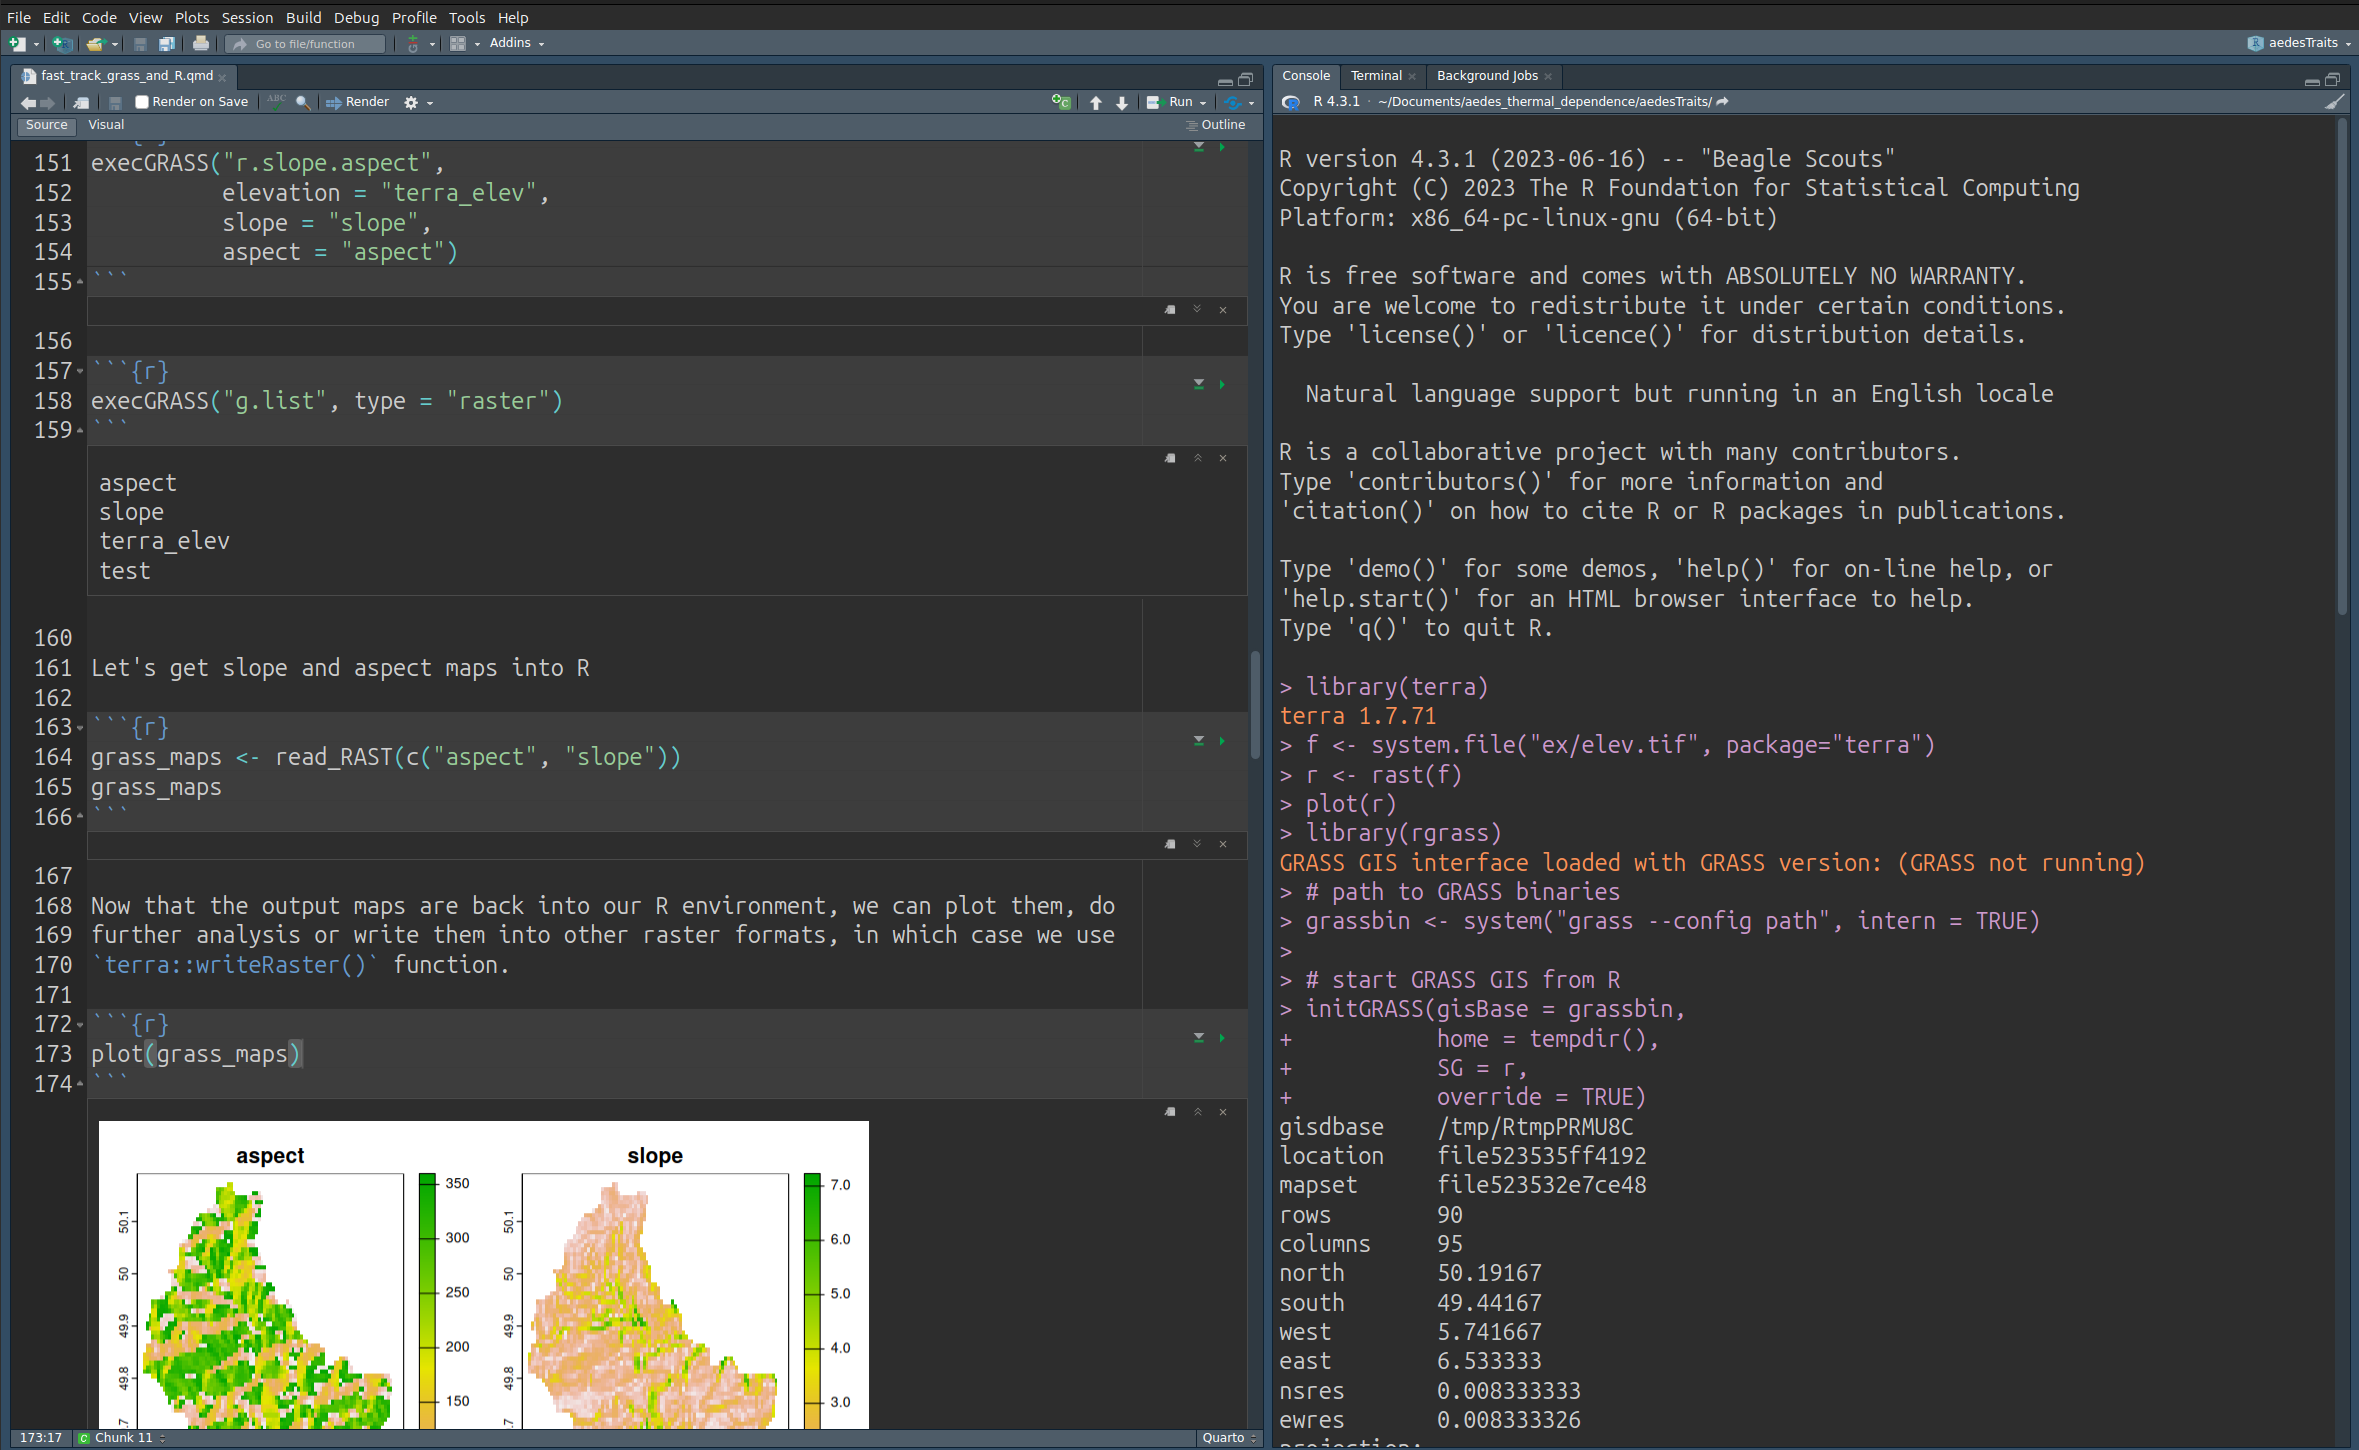
What is GRASS GIS?
Geovisualization and data analytics tool in R or quarto notebooks
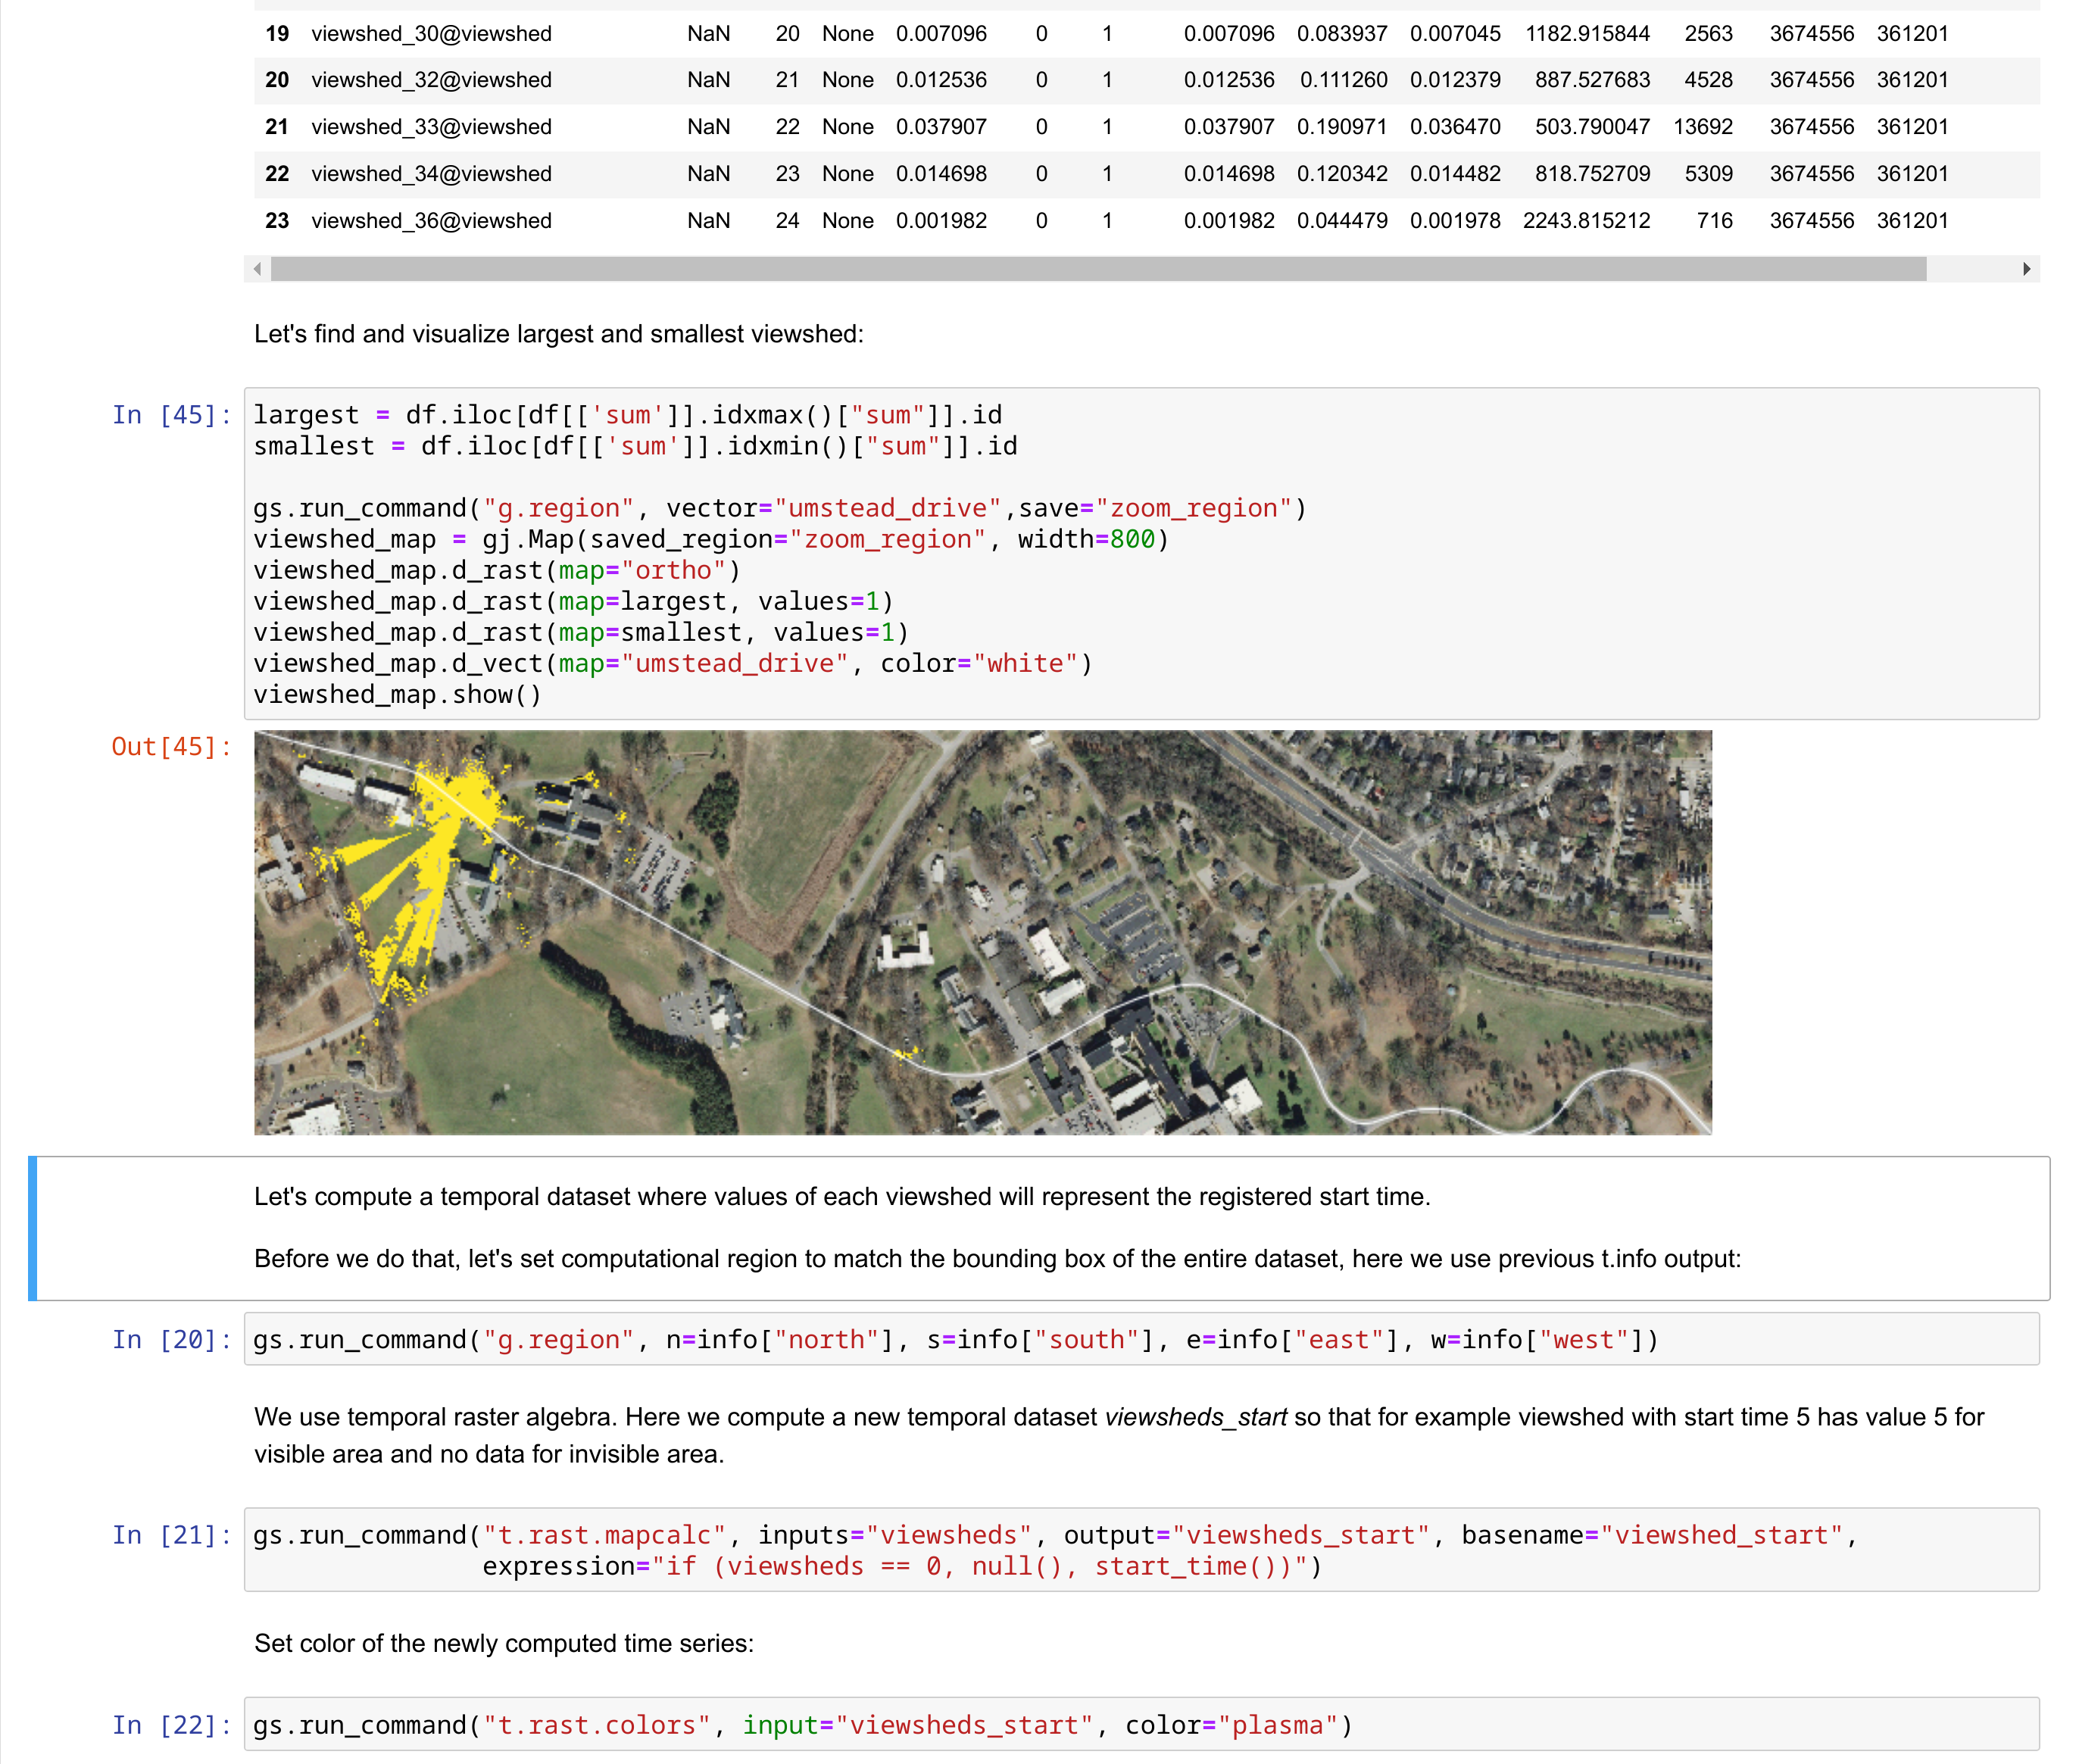
What is GRASS GIS?
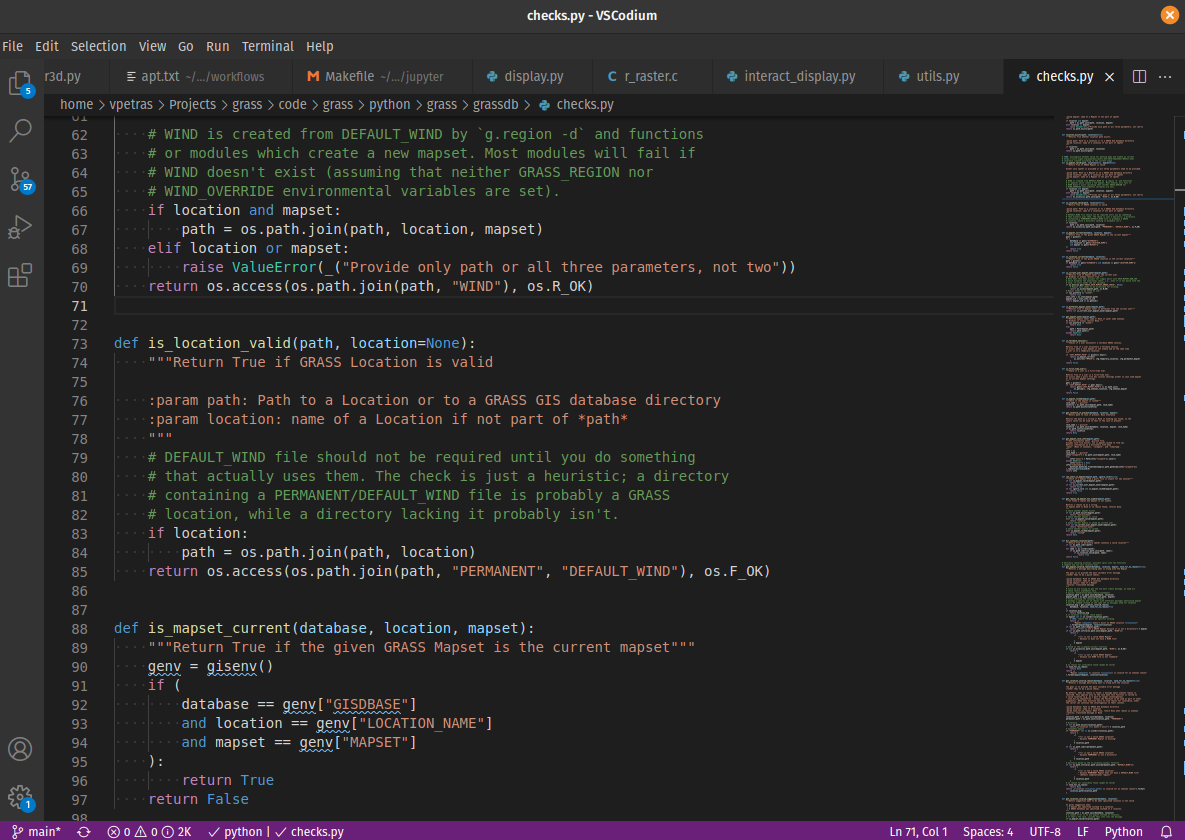
Geovisualization and data analytics tool in Python notebooks
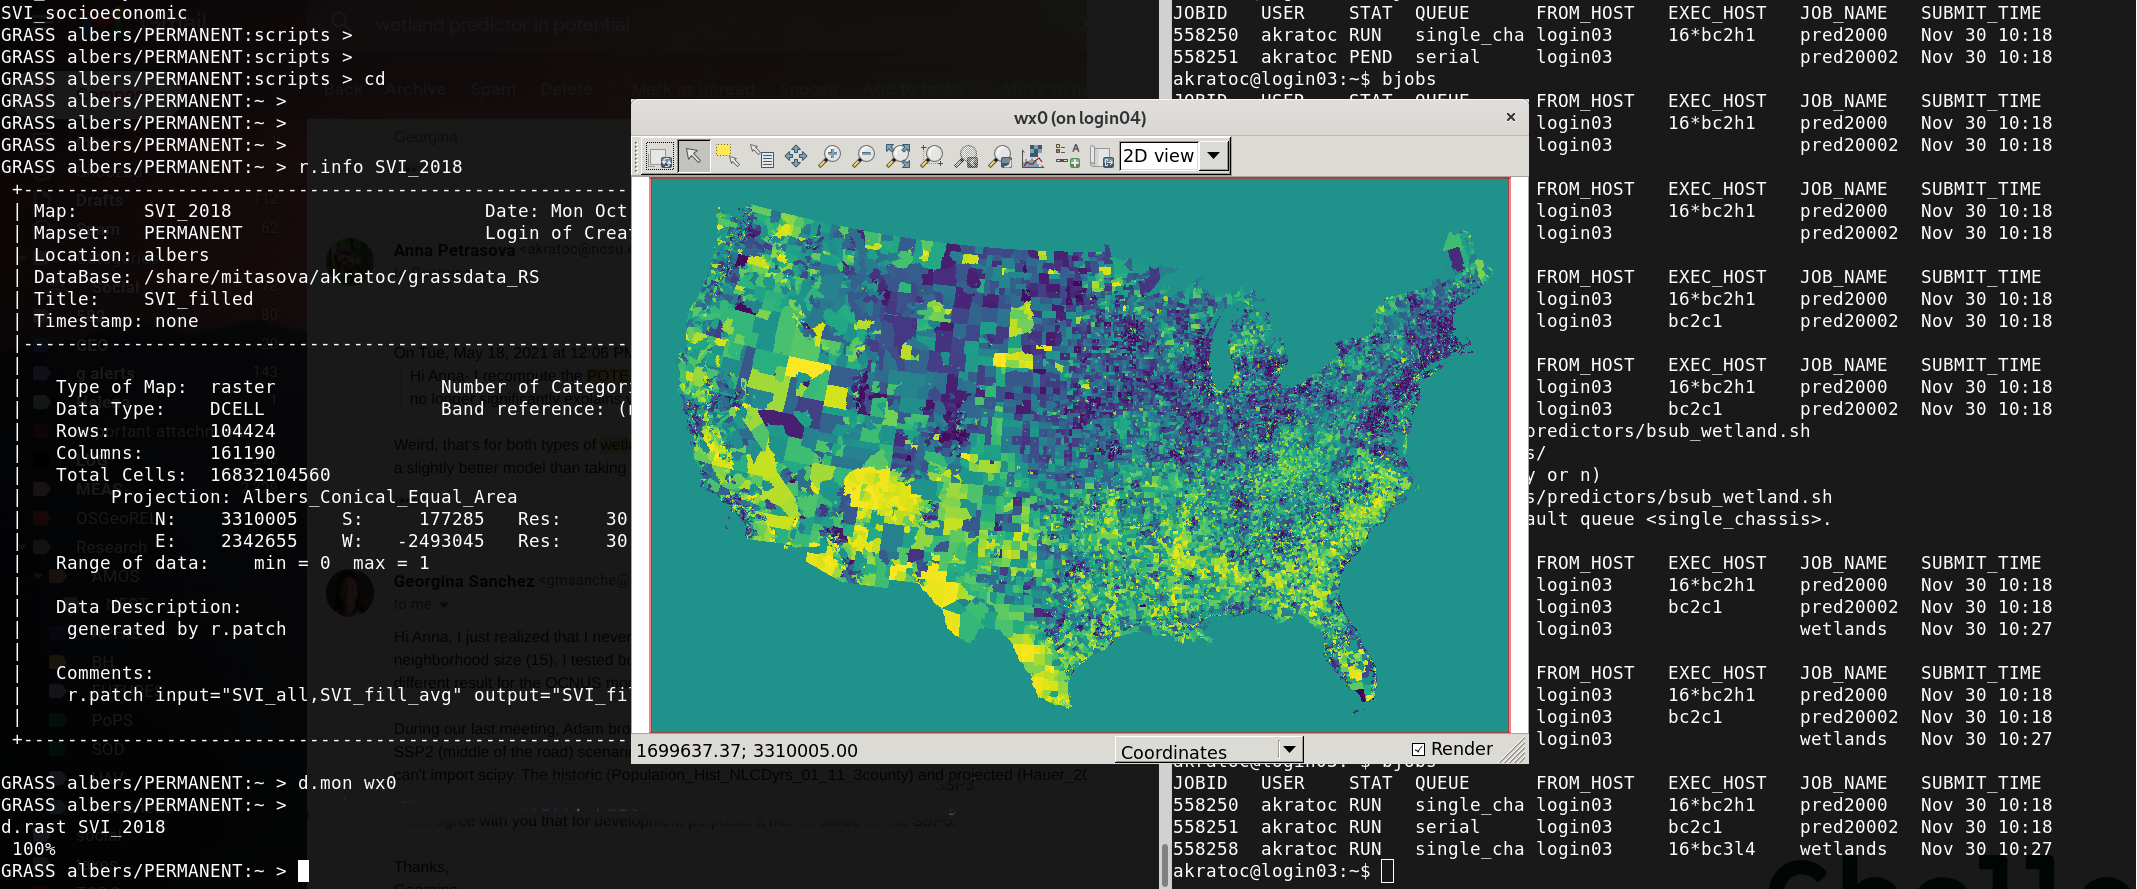
What is GRASS GIS?
Geoprocessing engine running in an HPC environment
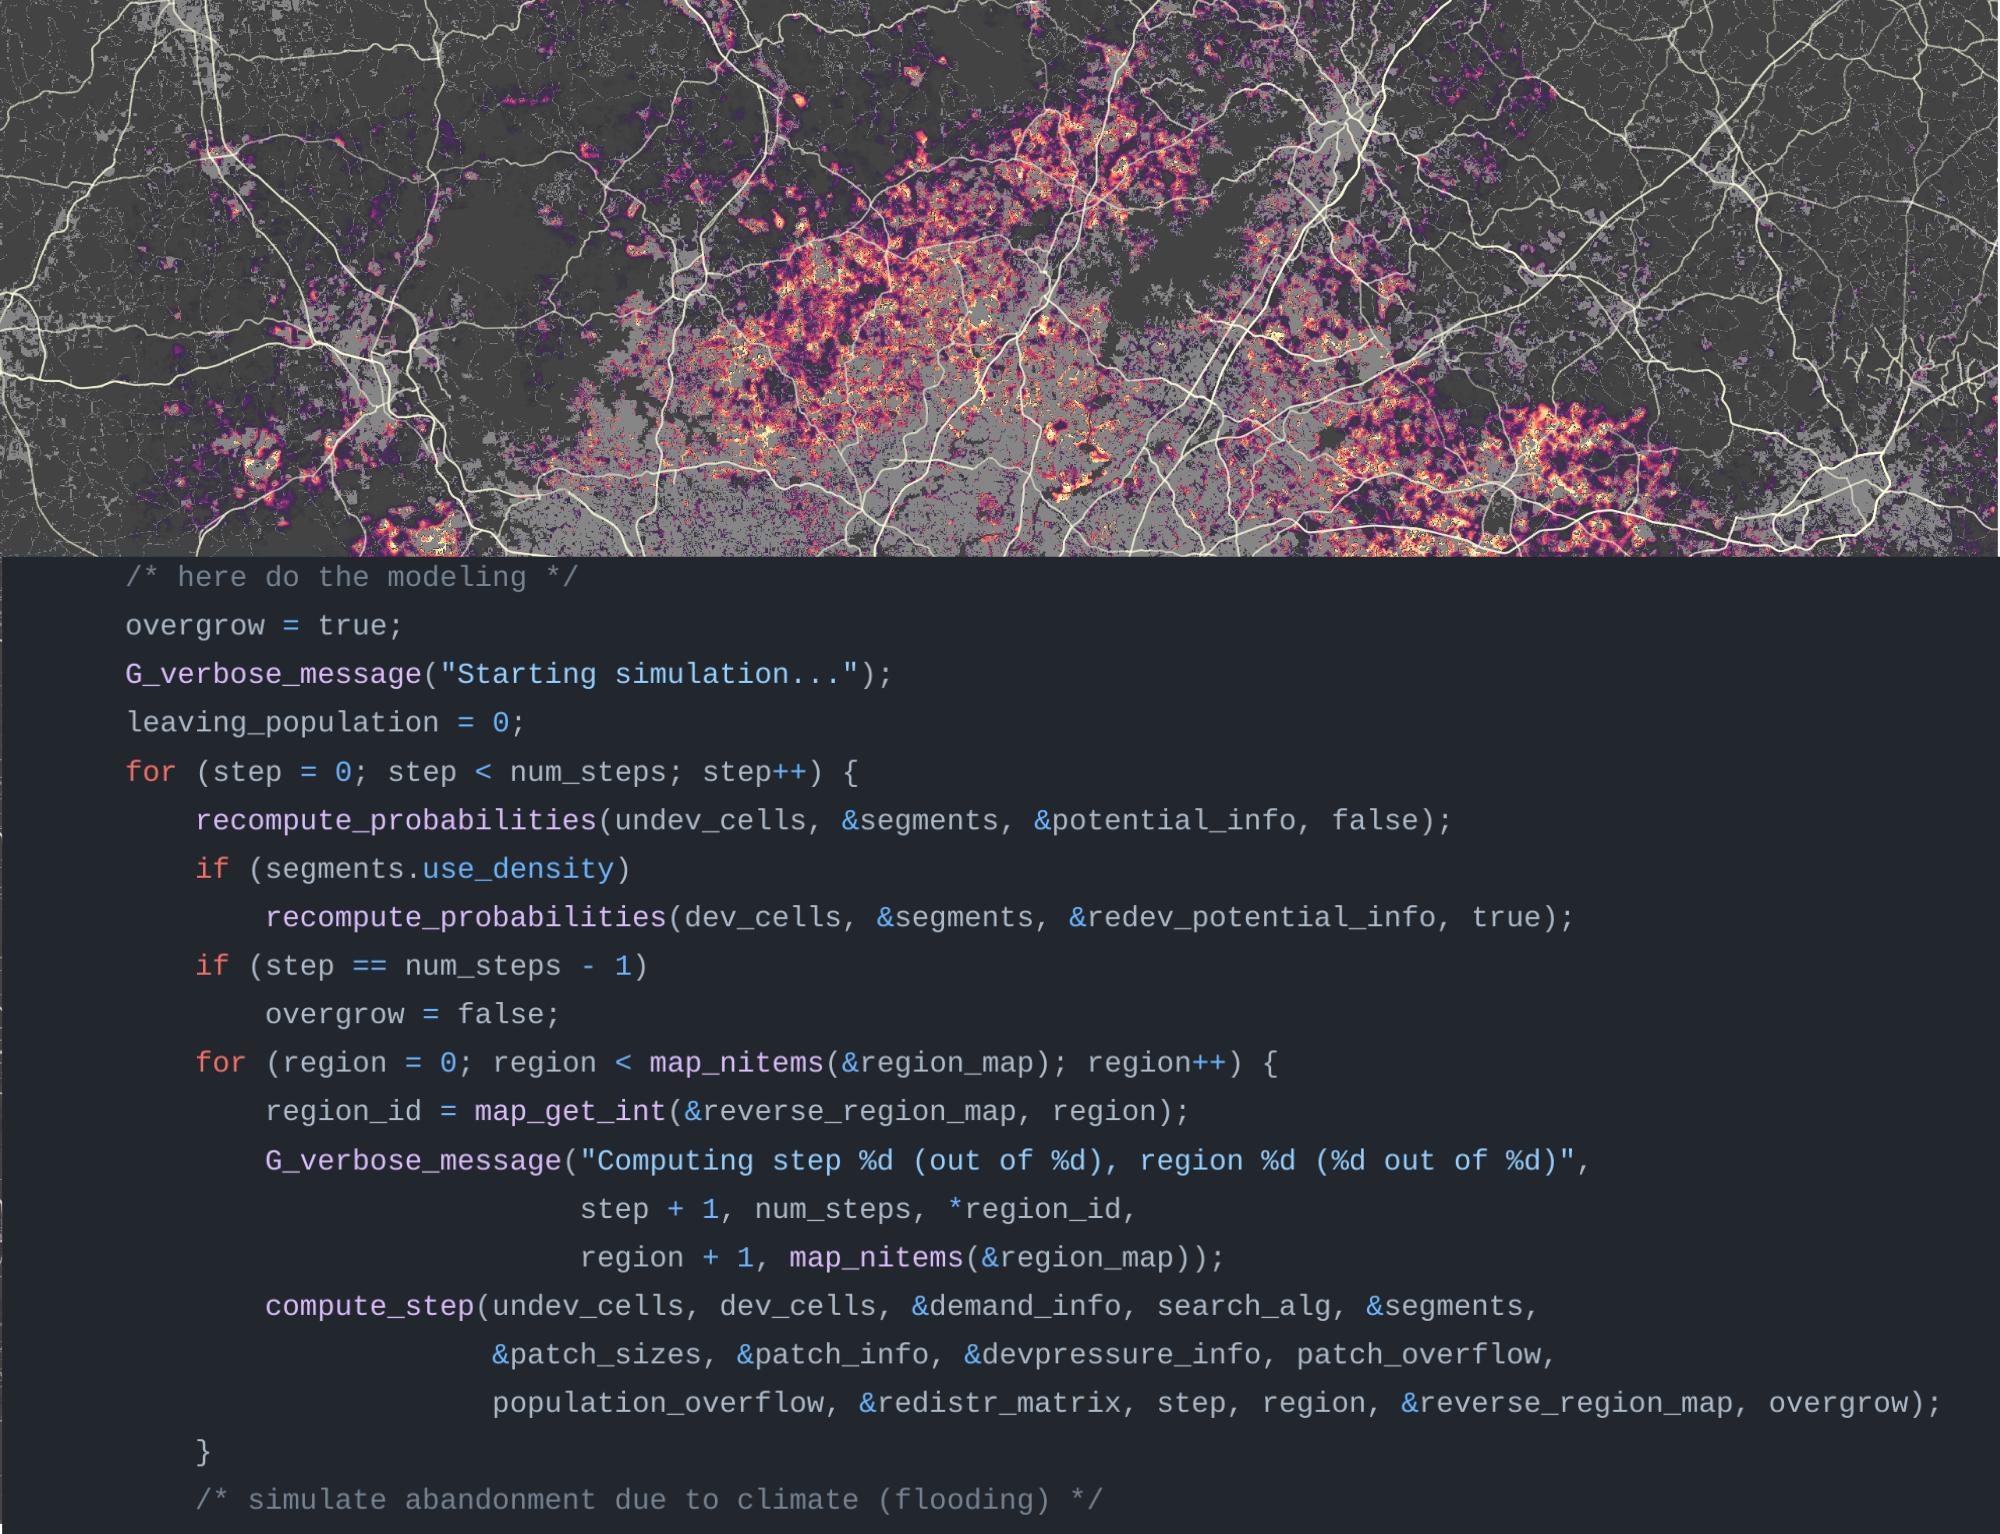
What is GRASS GIS?
Geospatial platform for developing custom models
What is GRASS GIS?
Cloud geoprocessing backend
 Image source: neteler.gitlab.io/actinia-introduction/
GRASS is all of that!
Robustness, Stability, Versatility, Scientific foundations

Releases
- 8.4 RC1 released, June 2024 https://github.com/OSGeo/grass/releases/tag/8.4.0RC1
- 8.3.2 Current, March 2024 Current version for everyday user
- 8.5.0 Preview, Daily Latest reviewed functional code
- 7.8.8 Legacy, August 2023 Last legacy release of 7.8 for some production systems

New features in GRASS 8.4
Tools
More machine learning in GRASS GIS!!
Supervised classification with Support Vector Machines
- i.svm.train: Train a Support Vector Machine
- i.svm.predict: Predict with a Support Vector Machine
 by Maris Nartiss (Nartiss & Melniks 2023)
Tools
More topology in GRASS GIS!!
v.fill.holes: Fill holes in areas by keeping only outer boundaries
 by Vaclav Petras
Tools
Streamline the connection of GRASS and other tools within data science workflows!!
            r.info elevation format=json
            {
                "north": 228500,
                "south": 215000,
                "nsres": 10,
                "east": 645000,
                "west": 630000,
                "ewres": 10,
                "rows": 1350,
                "cols": 1500,
                "cells": 2025000,
                "datatype": "FCELL",
                "ncats": 255,
                "min": 55.578792572021484,
                "max": 156.32986450195312,
                "map": "elevation",
                ...
            }
JSON output format support (format="json") in multiple tools
(e.g., r.report, r.info, v.db.select, t.rast.list, etc.)
Tools
Revamped unique GRASS tools!
r.horizon: Output for multiple points, distances, and many other improvements
 Anna Petrasova, funded by NSF Award #2322073, granted to Natrx, Inc.
API and Library changes
grass.script Python package:
Greatly simplified the creation of new projects in Python without a running session (no more chicken and egg problems)
            import grass.script as gs
            import grass.jupyter as gj

            gs.create_location("cordoba_utm21s", epsg="32721")
            gj.init("cordoba_utm21s")
API and Library changes
grass.jupyter Python package:
- New
grass.jupyter.SeriesMapclass for animating series of vectors or rasters. See grass.jupyter.SeriesMap doc. ipyleafletintegration to create a map in ipyleaflet and add GRASS data in a single line
        series = gj.SeriesMap(height = 500)
        series.add_rasters(["elevation_shade", "geology", "soils"])
        series.add_vectors(["streams", "streets", "viewpoints"])
        series.d_barscale()
        series.show()
GUI: New history browser panel
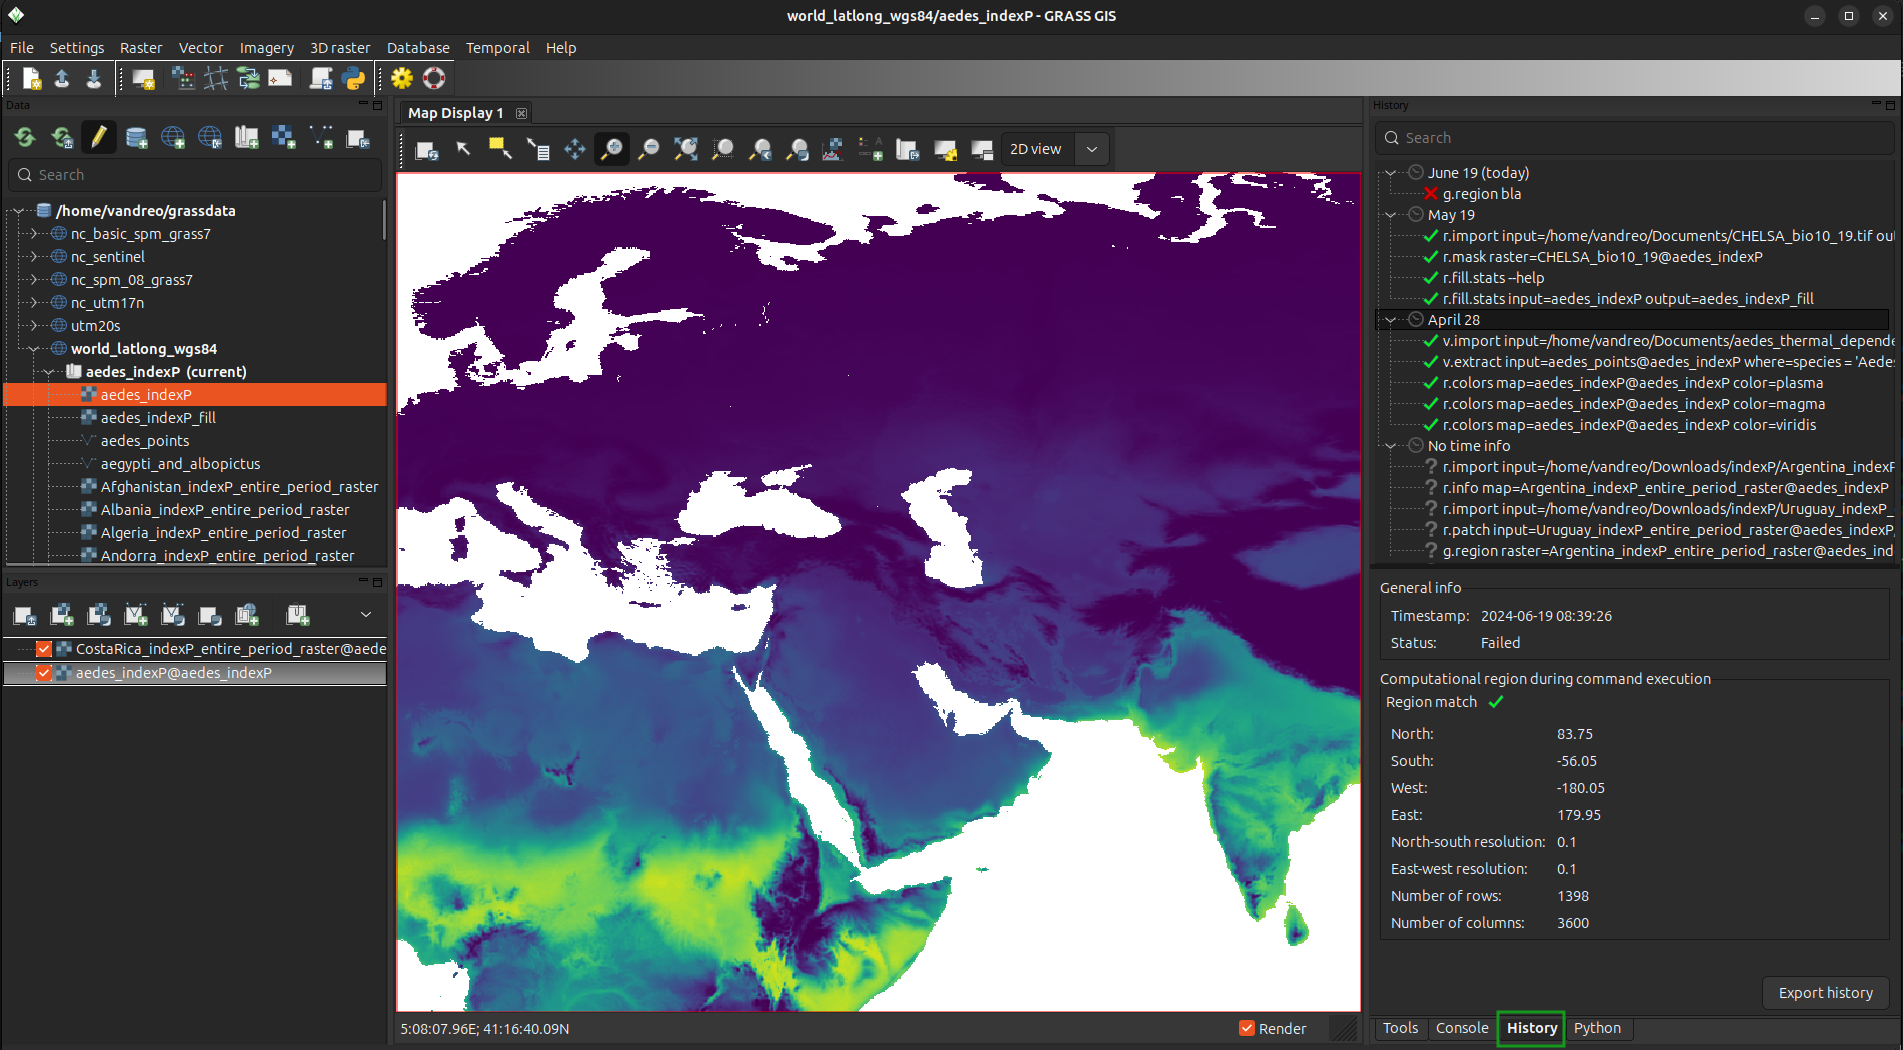 by Linda Karlovska with a GRASS GIS Student Grant
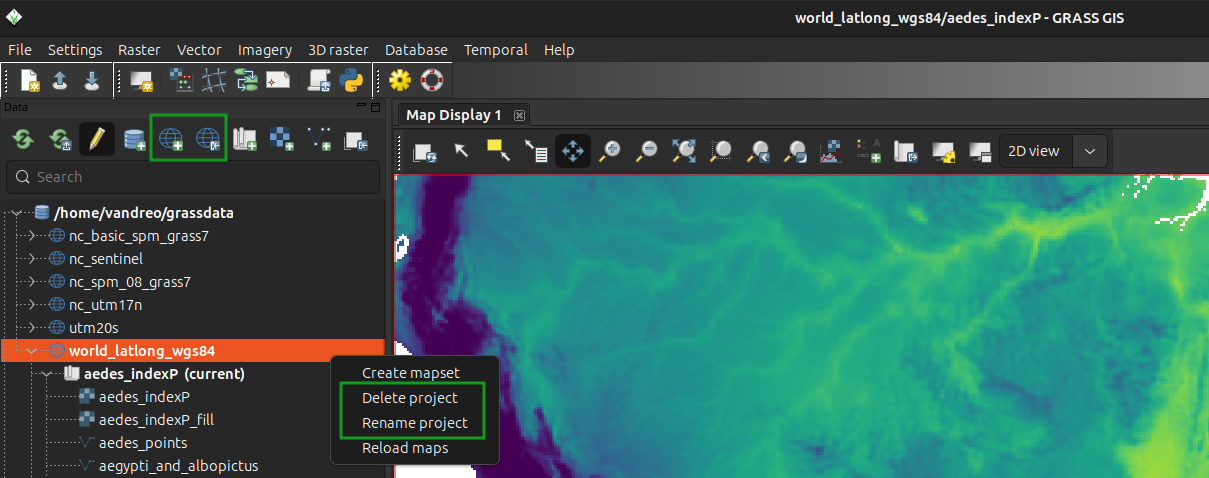
locations became projects!!
The Python API, command line, and GUI are now using project instead of location for the main component of the data hiearchy.
New extensions
- r.flowaccumulation: Calculates flow accumulation from a flow direction using the Memory-Efficient Flow Accumulation (MEFA) parallel algorithm by Cho (2023).
- r.fusion: image fusion, generalized pan-sharpening, funded by mundialis GmbH & Co. KG.
- r.maxent.train & r.maxent.predict: train and predict a Maxent model to create a suitability distribution maps.
- ... plotting tools, and tools to streamline access to different types of data.
Code quality and security
C and C++
- Issues reported by GCC and Clang such as dangling-else, discarded-qualifiers, format, … fixed.
Python
- Code formatted with Black
- Flake8 enabled, 3/4 fixed
- Pylint partially enabled
Code security
- Bandit for vulnerabilities in Python
- CodeQL for security issues in C and C++
- Coverity for security and code quality in C and C++
Distribution
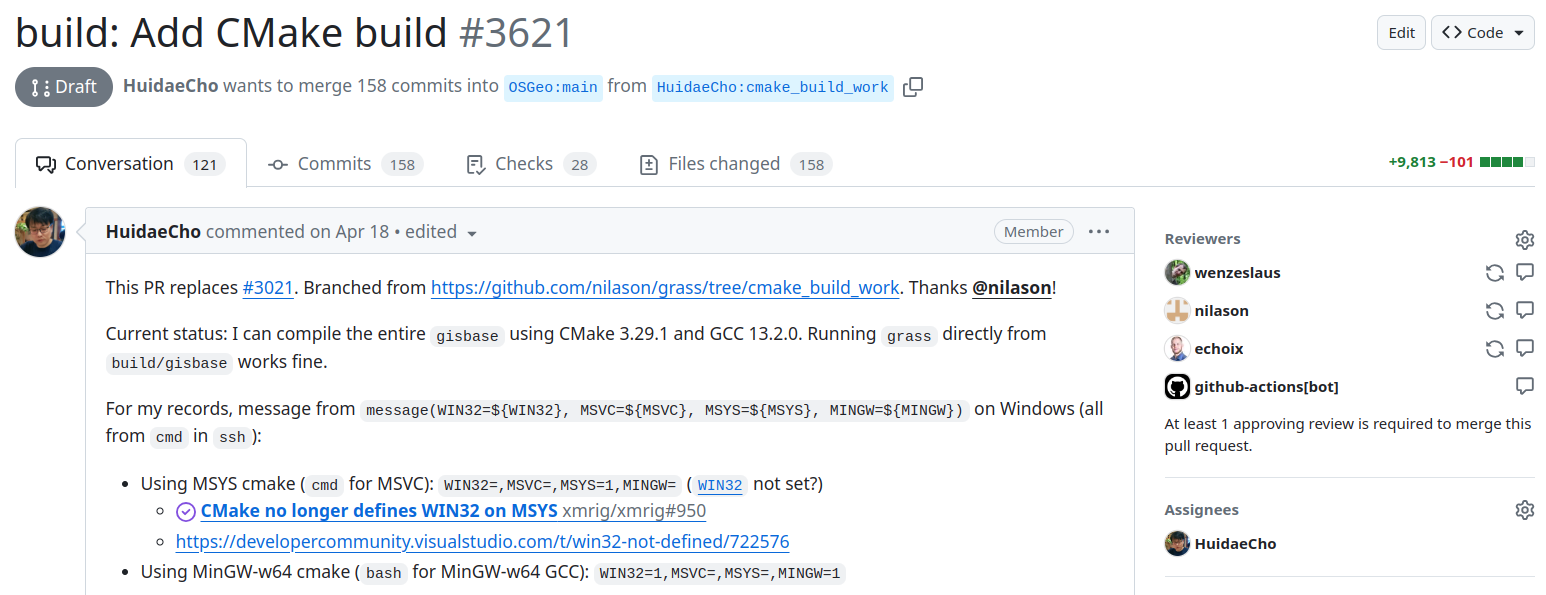
- Getting ready to the transition to CMake based compilation
- Advancements towards compliance with Filesystem Hierarchy Standard (FSH)
- GRASS GIS conda package on the way...
Mentoring and Student Grants Program
- Student grants to contribute to GRASS GIS: 1 student in 2023-2024. Call is open for this fall!
- Mentoring to integrate GRASS GIS into your workflows: 11 people working on various topics. Call still open!
GSoC 2024
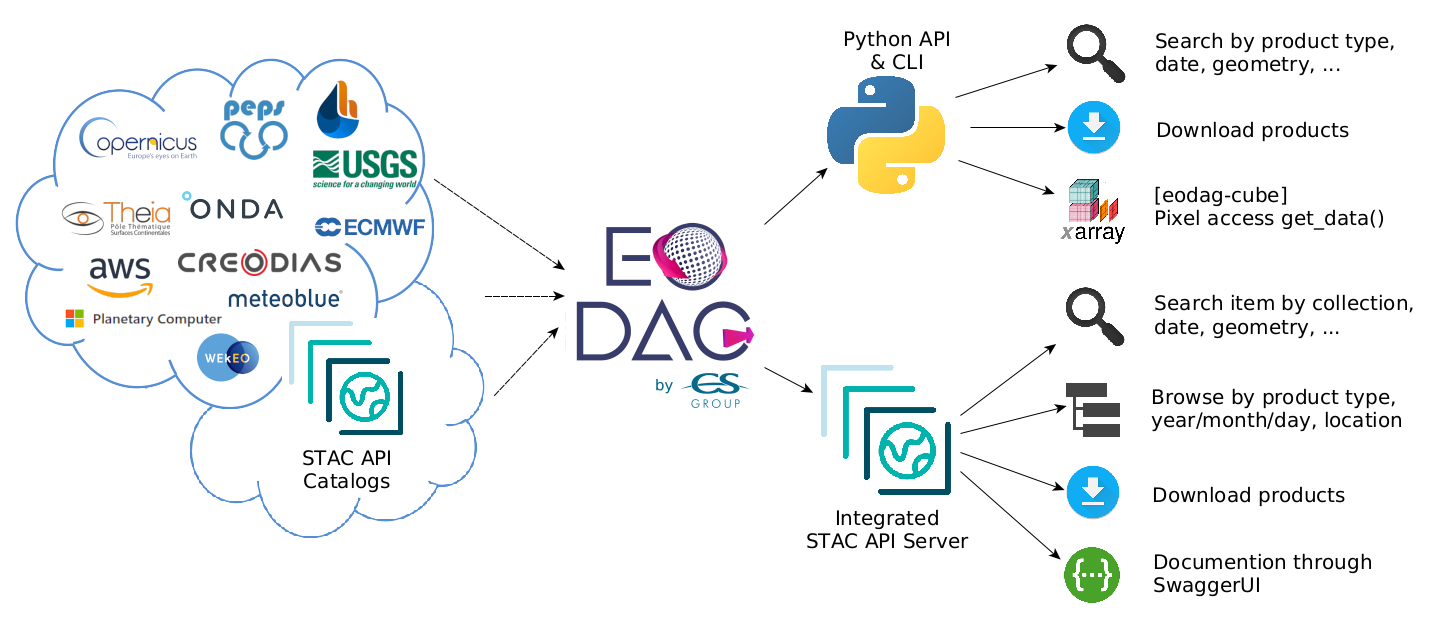
Add EODAG support to GRASS GIS
Student: Hamed AshrafMentors: Luca Delucchi, Veronica Andreo, Stefan Blumentrath
i.eodag: Downloads imagery datasets from various providers through the EODAG library.
            v.extract input=urbanarea where="NAME = 'Durham'" output=durham

            i.eodag -l start=2022-05-25 end=2022-06-01 clouds=30 \
                    map=durham dataset=S2_MSI_L2A provider=cop_dataspace
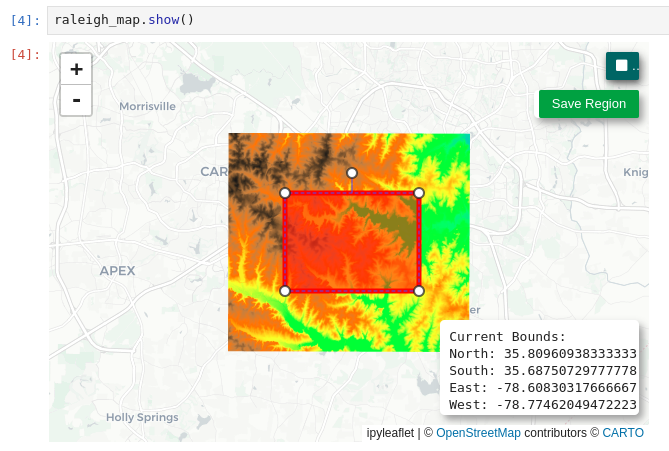
Improve GRASS user experience in Jupyter Notebook
Student: Riya SaxenaMentors: Anna Petrasova, Corey White
Enable users to query attribute values and draw geometries, display and change the computational region, support for custom CRS
Add JSON output to different GRASS tools in C
Student: Kriti BirdaMentors: Corey White and Vaclav Petras
            r.what map=MOD11B3.A2015001.h11v05.single_LST_Day_6km points=firestations format=json
            [
                {
                    "easting": 620856.95858763403,
                    "northing": 230066.38313210499,
                    "MOD11B3.A2015001.h11v05.single_LST_Day_6km": {
                        "value": 14045
                    }
                },
                {
                    "easting": 625331.91859749099,
                    "northing": 229990.82160762601,
                    "MOD11B3.A2015001.h11v05.single_LST_Day_6km": {
                        "value": 14099
                    }
                },
                {
                    "easting": 615797.66547487001,
                    "northing": 213363.99261982701,
                    "MOD11B3.A2015001.h11v05.single_LST_Day_6km": {
                        "value": 14031
                    }
                }
            ]
Community
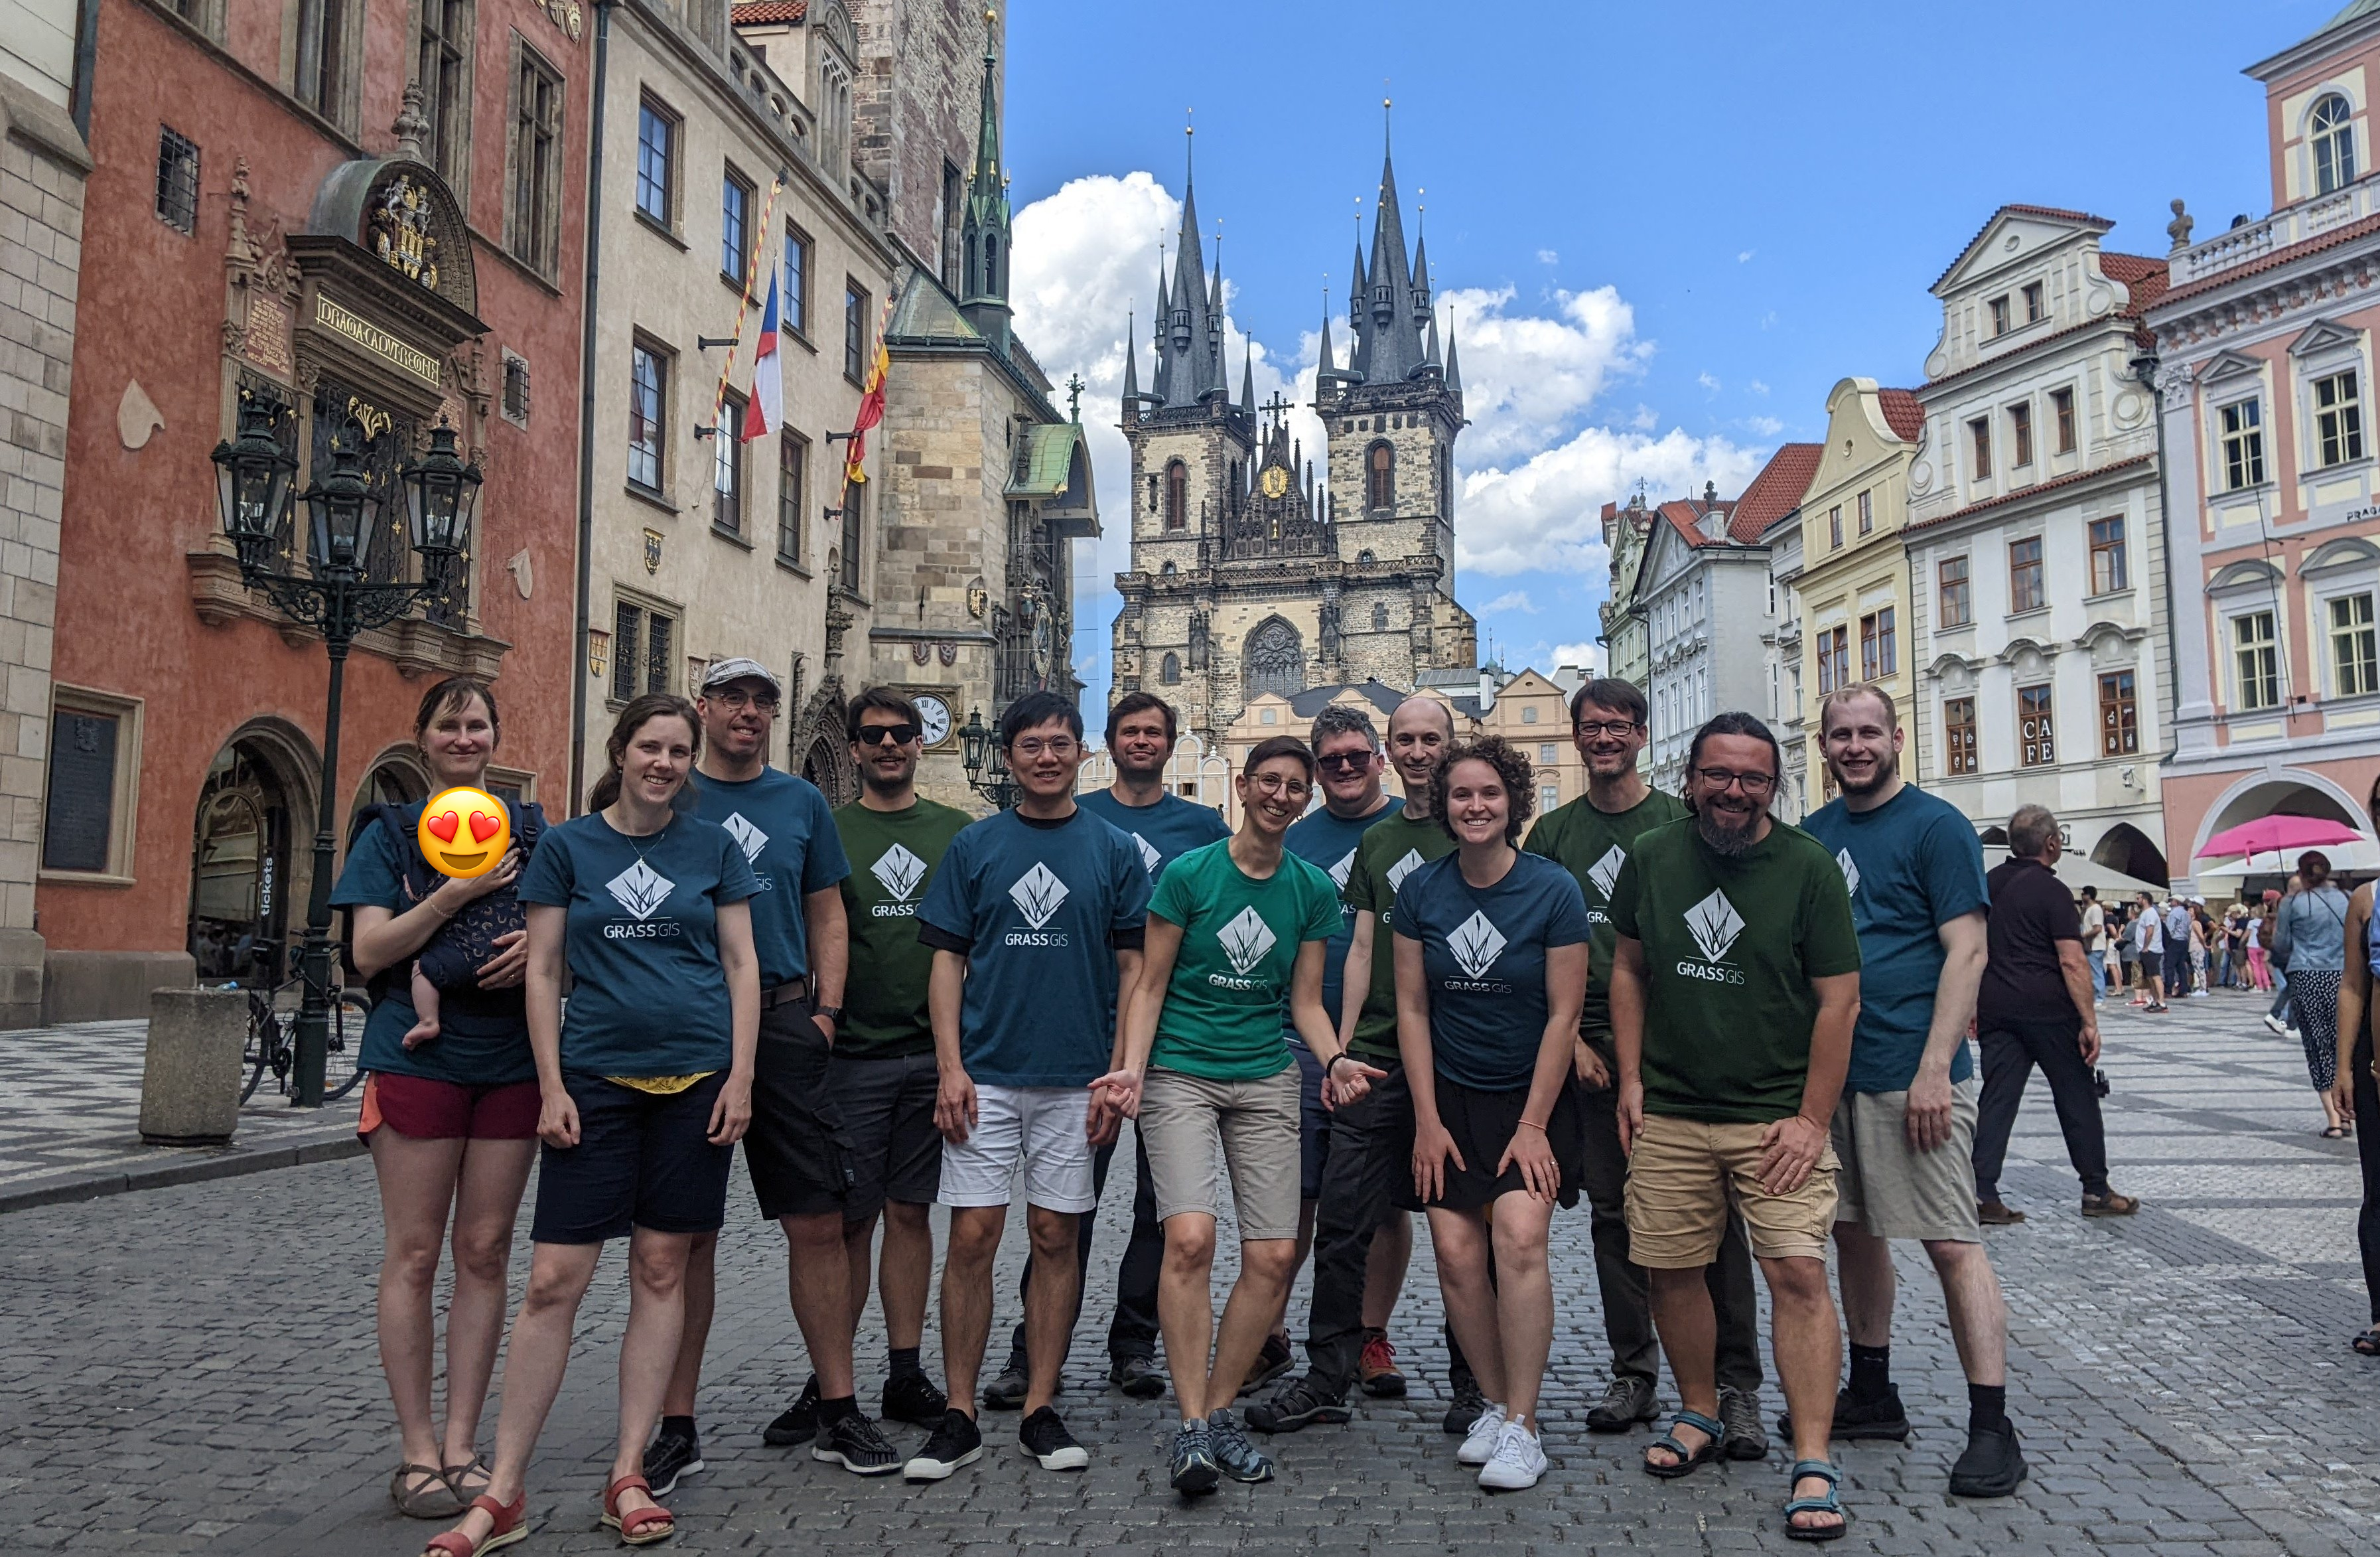
Community growth
- Two new contributors with write access: Edouard Choiniere and Linda Karlovska. Welcome!!
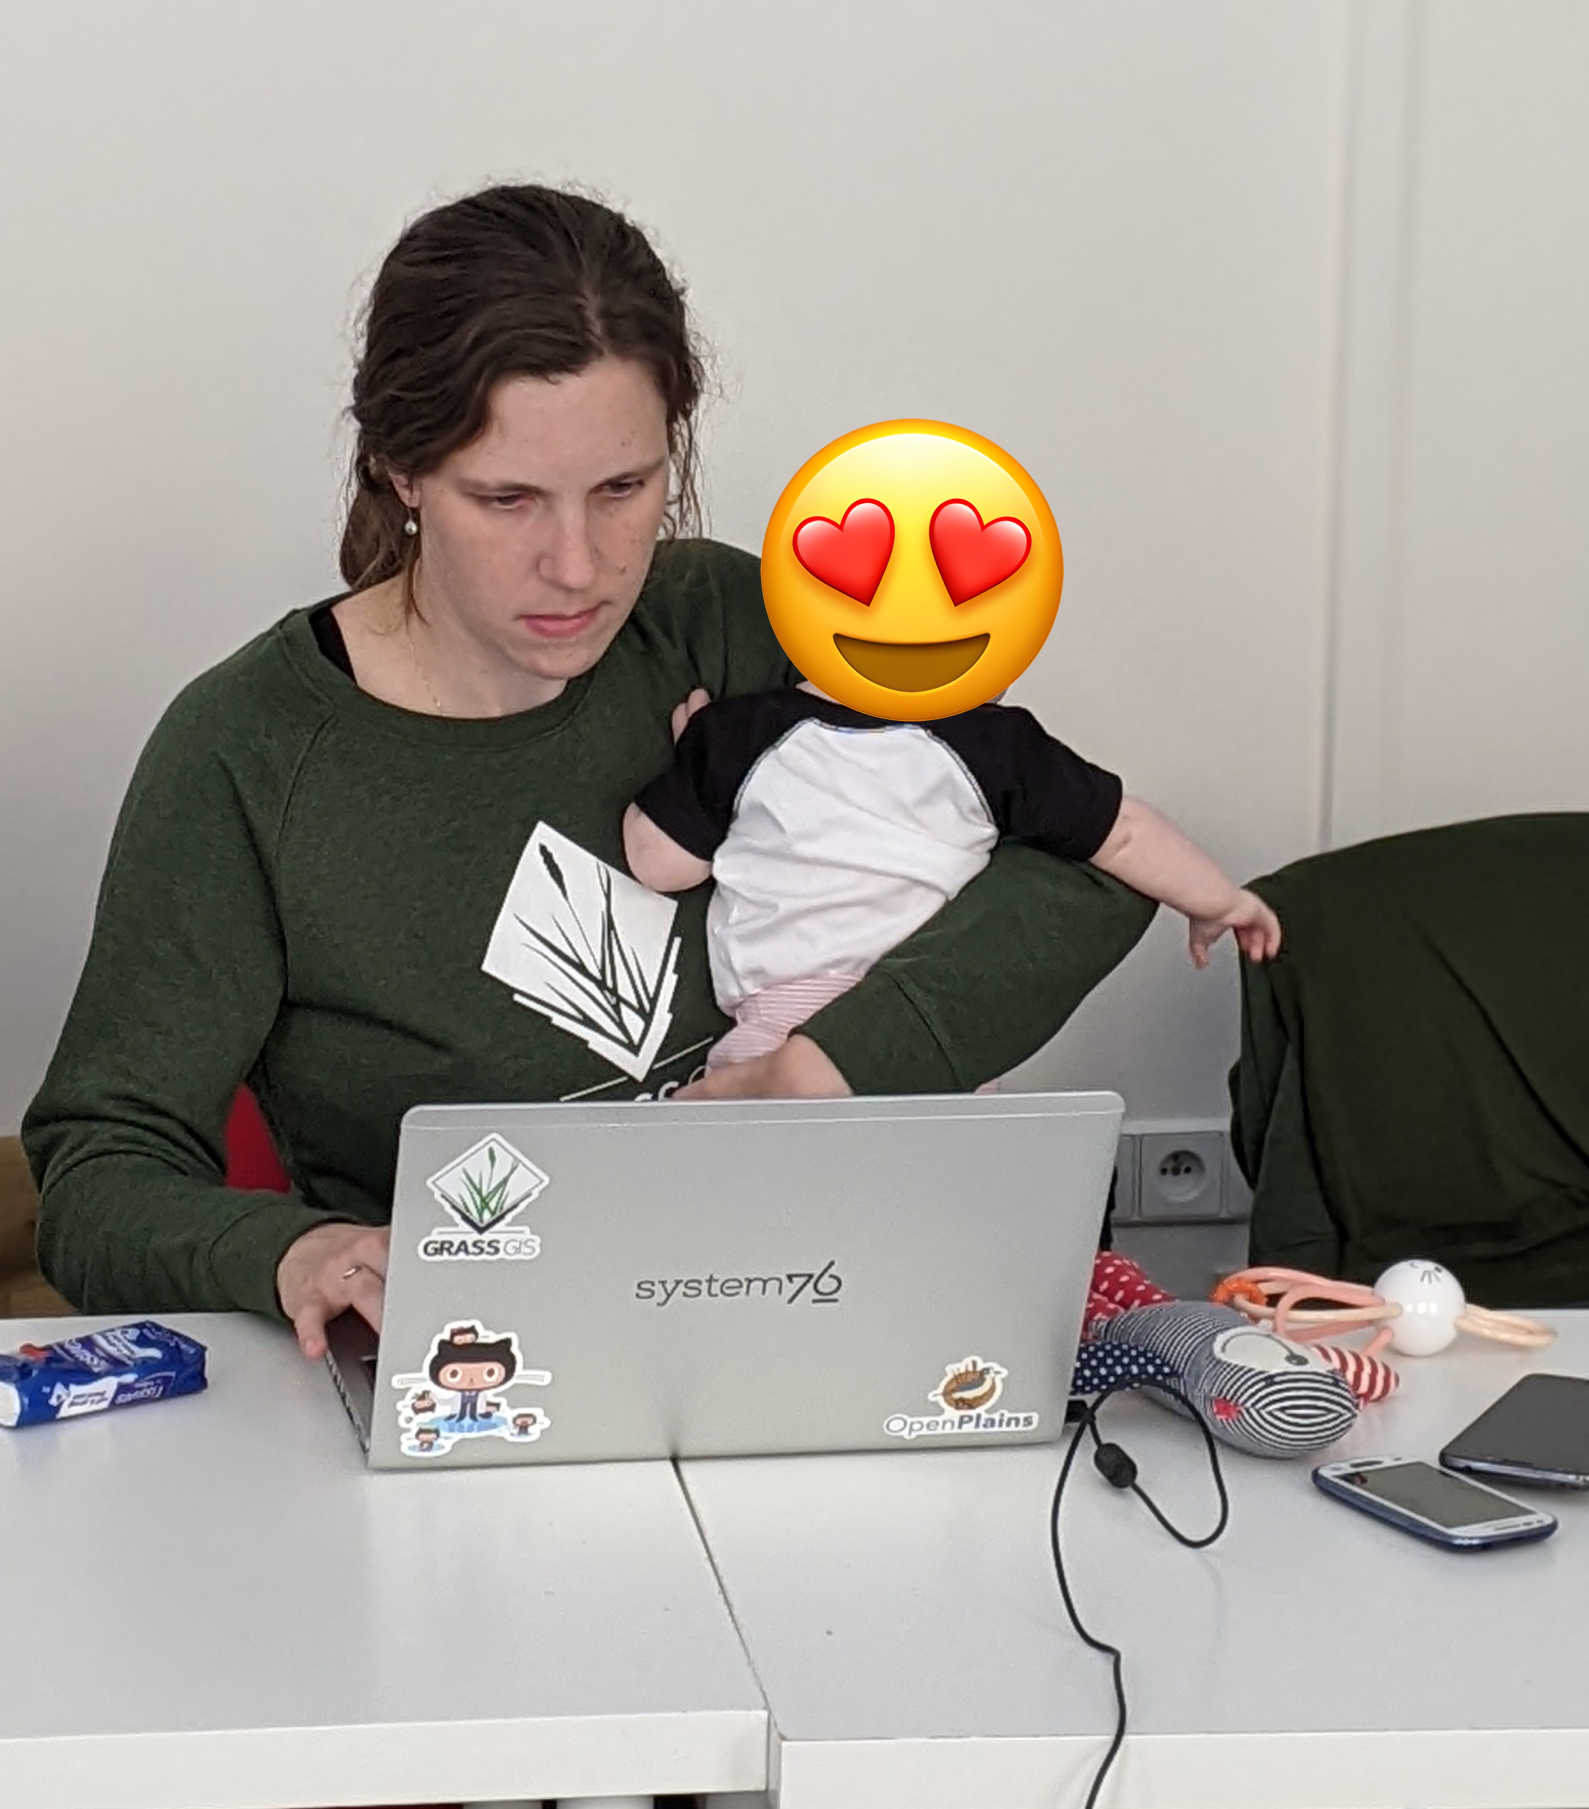
- Three new GRASS GIS babies! Congratulations!!
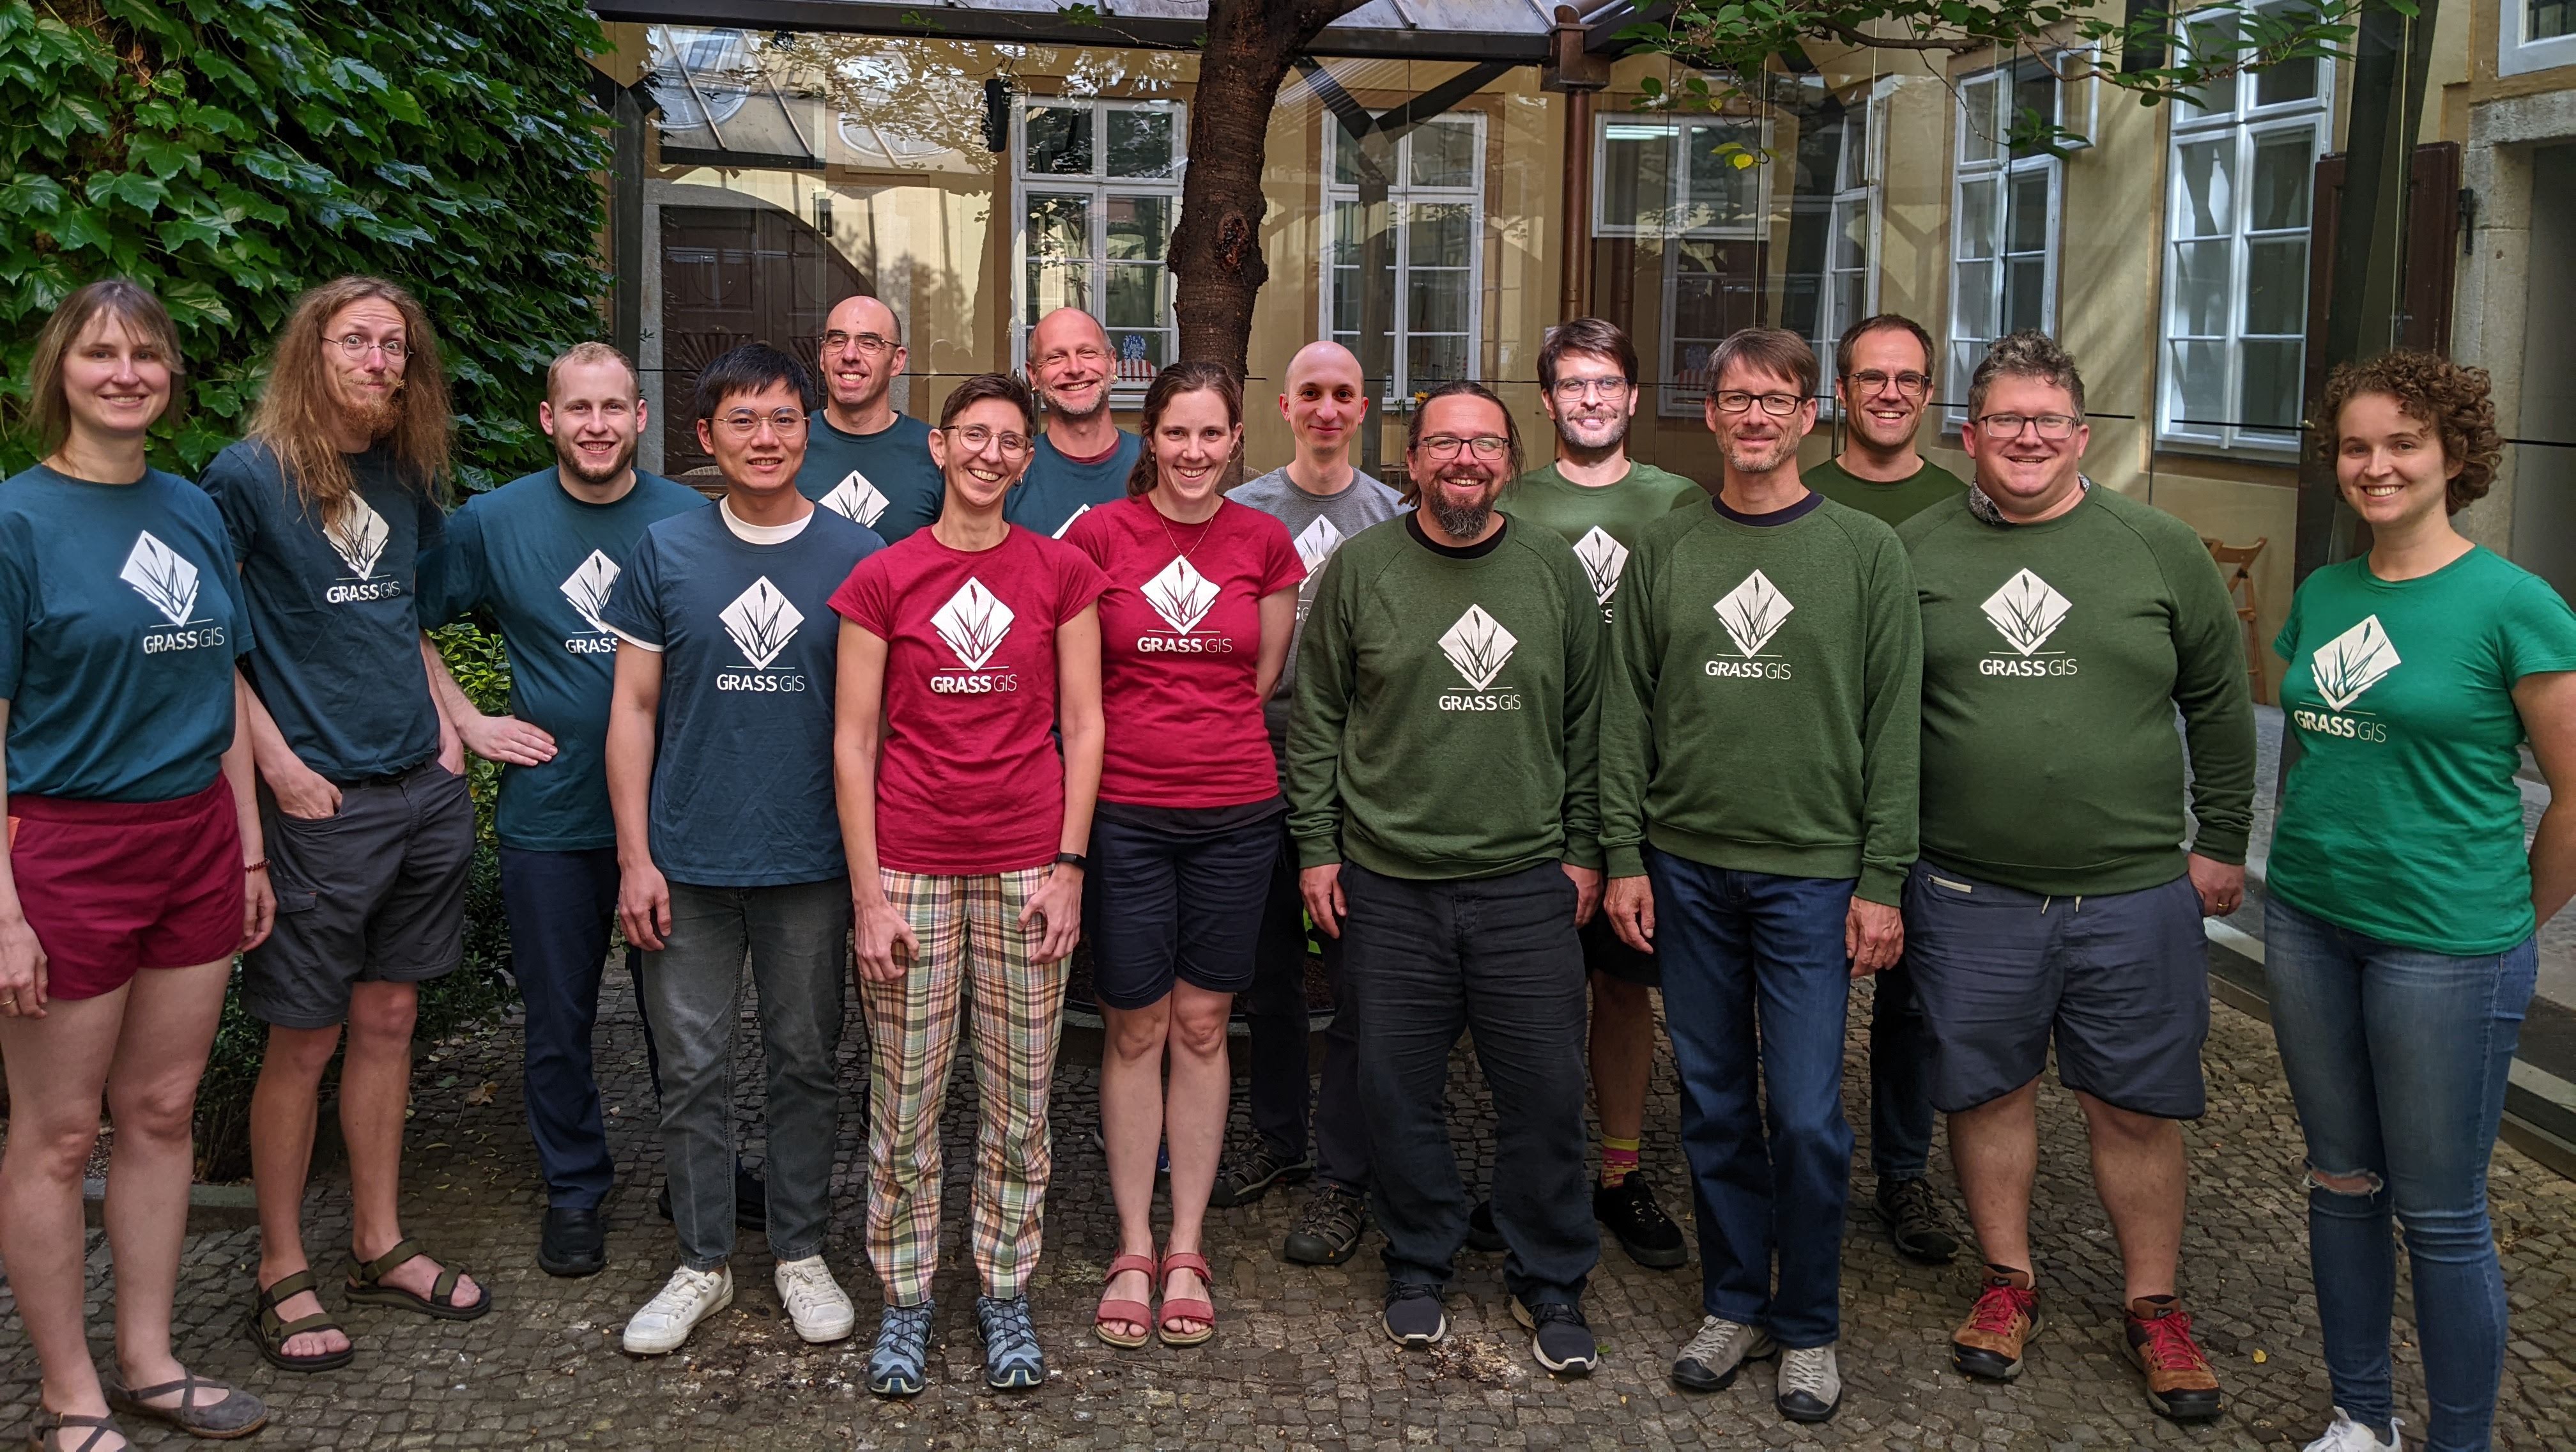
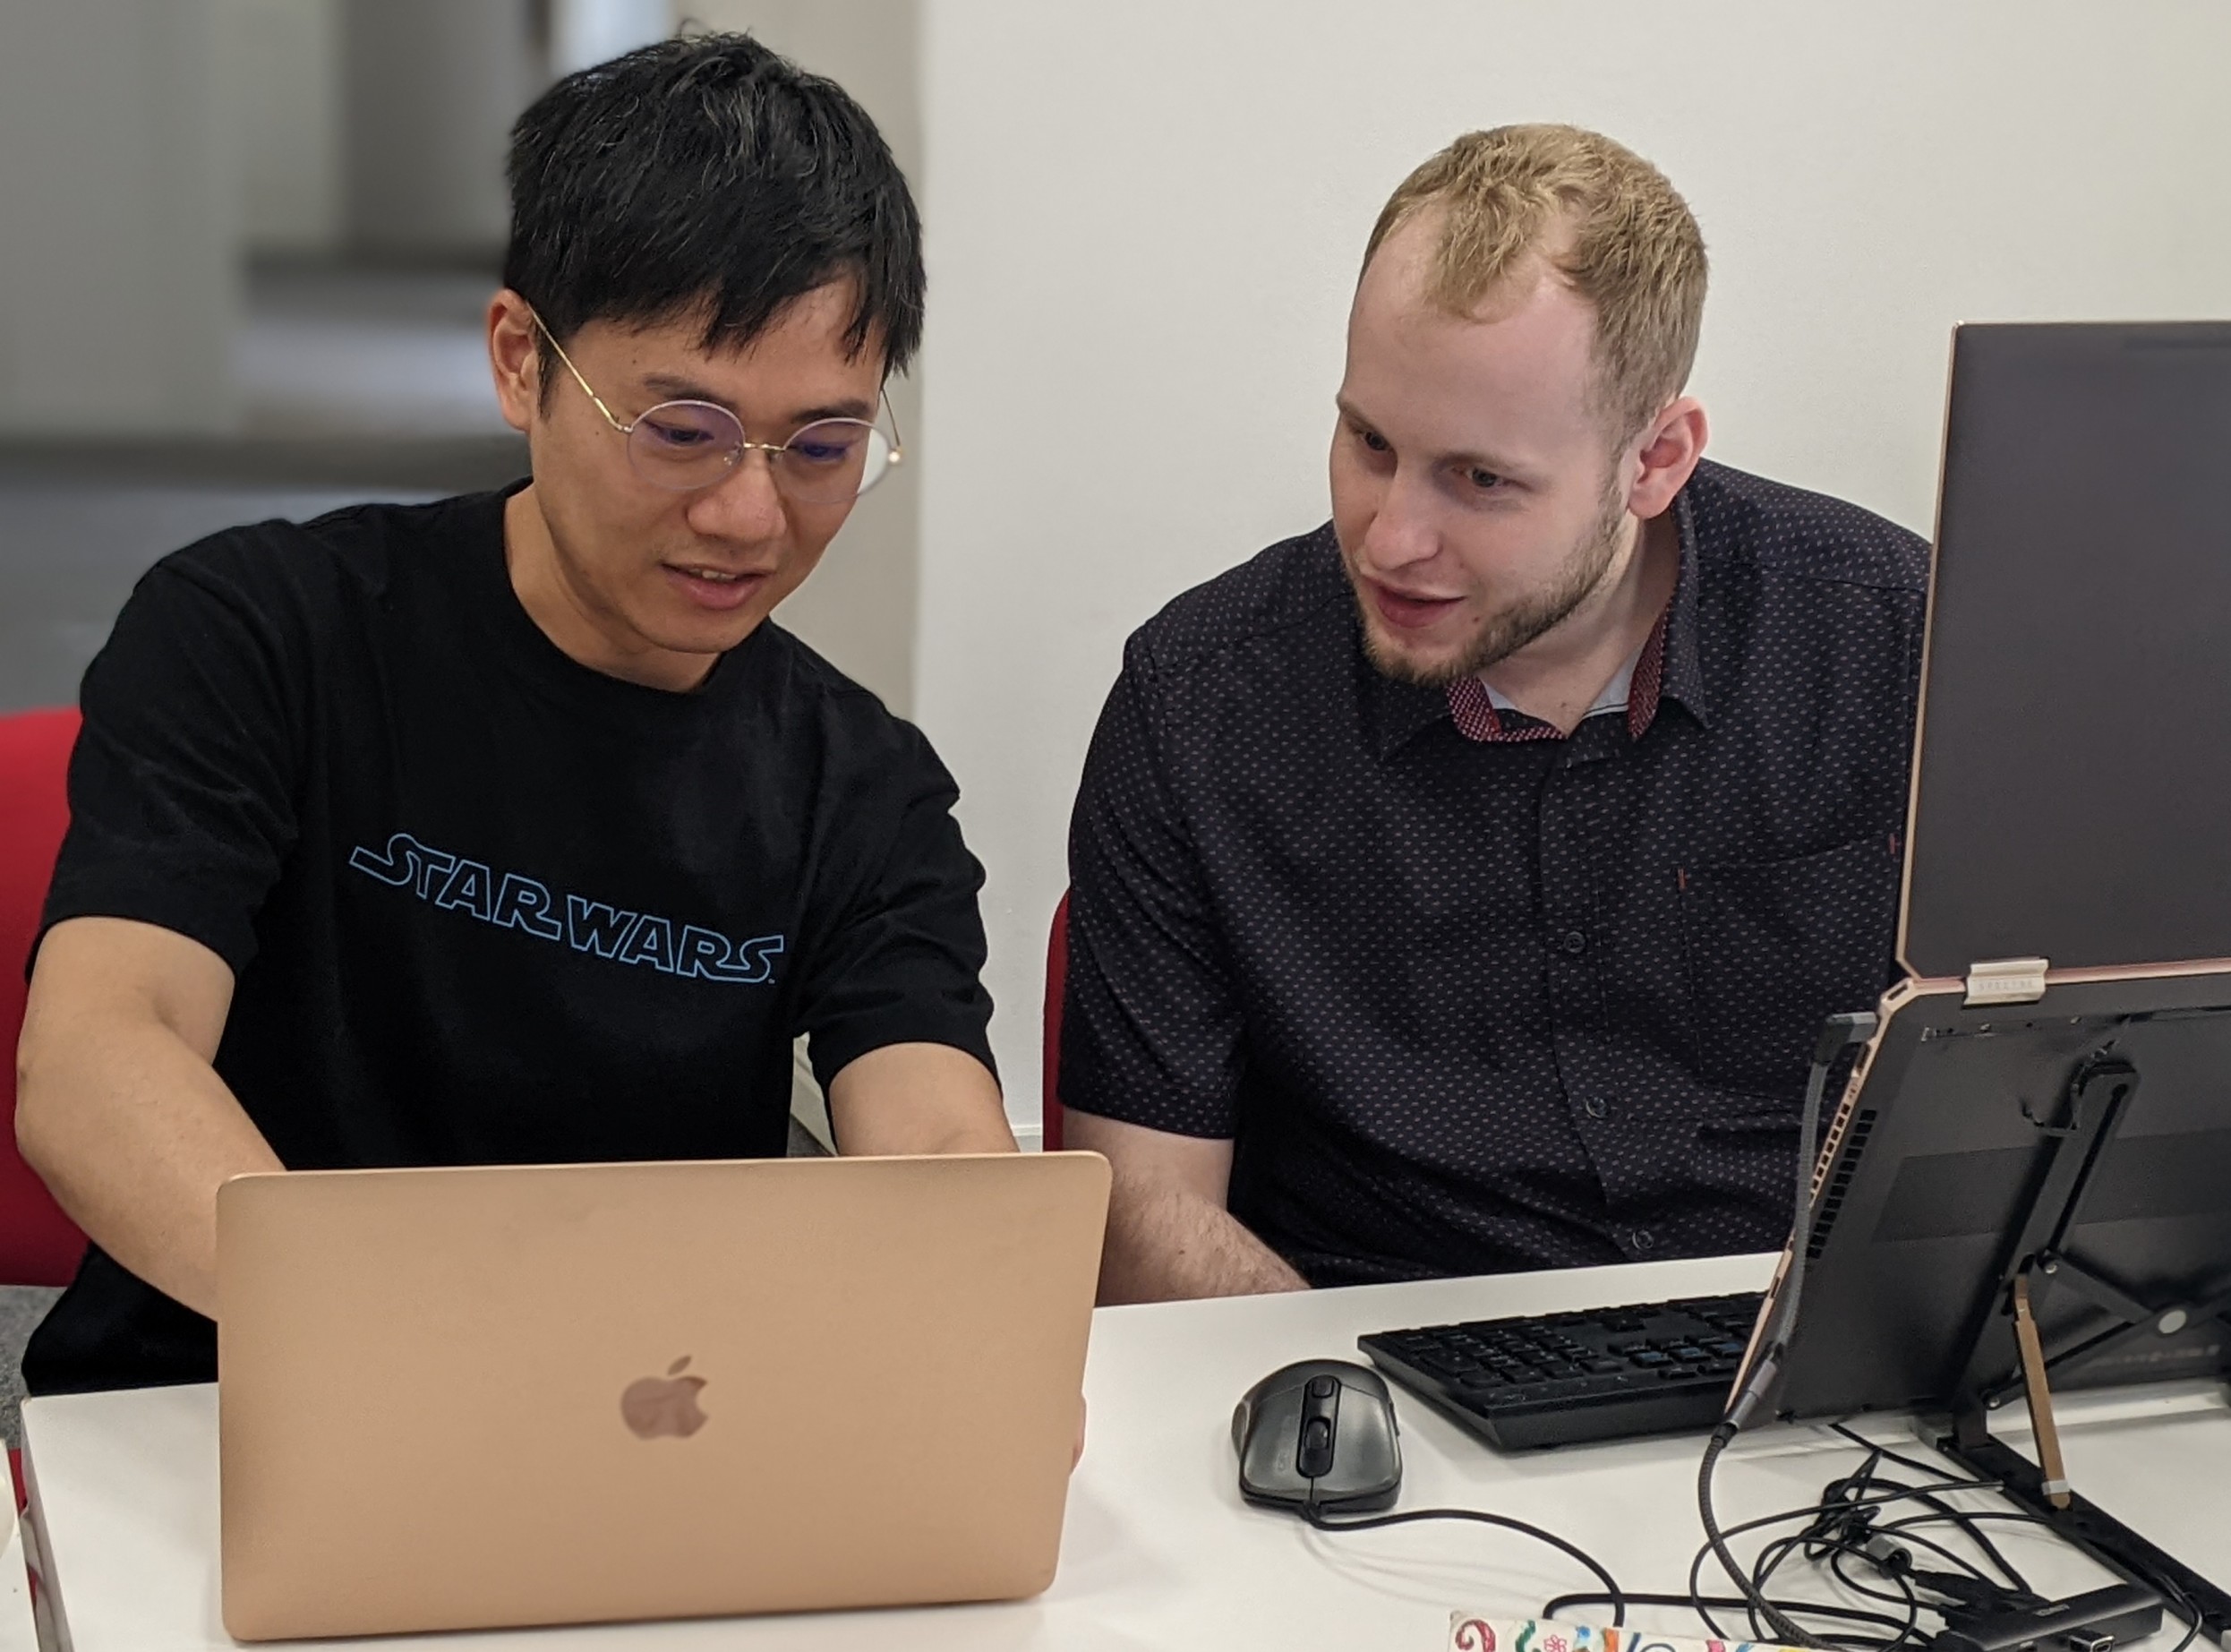
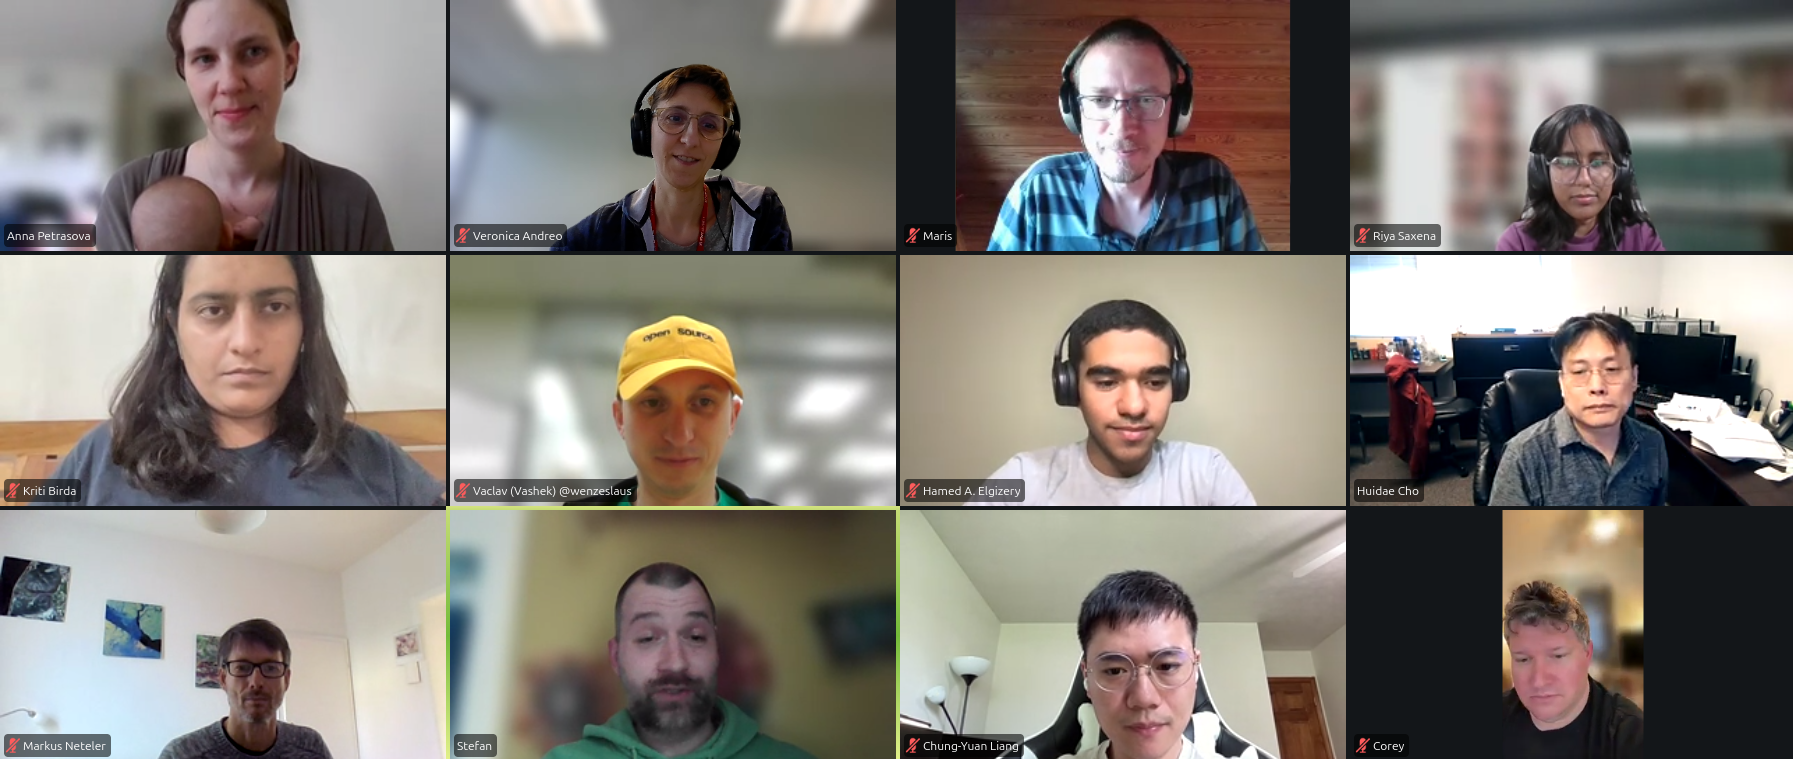
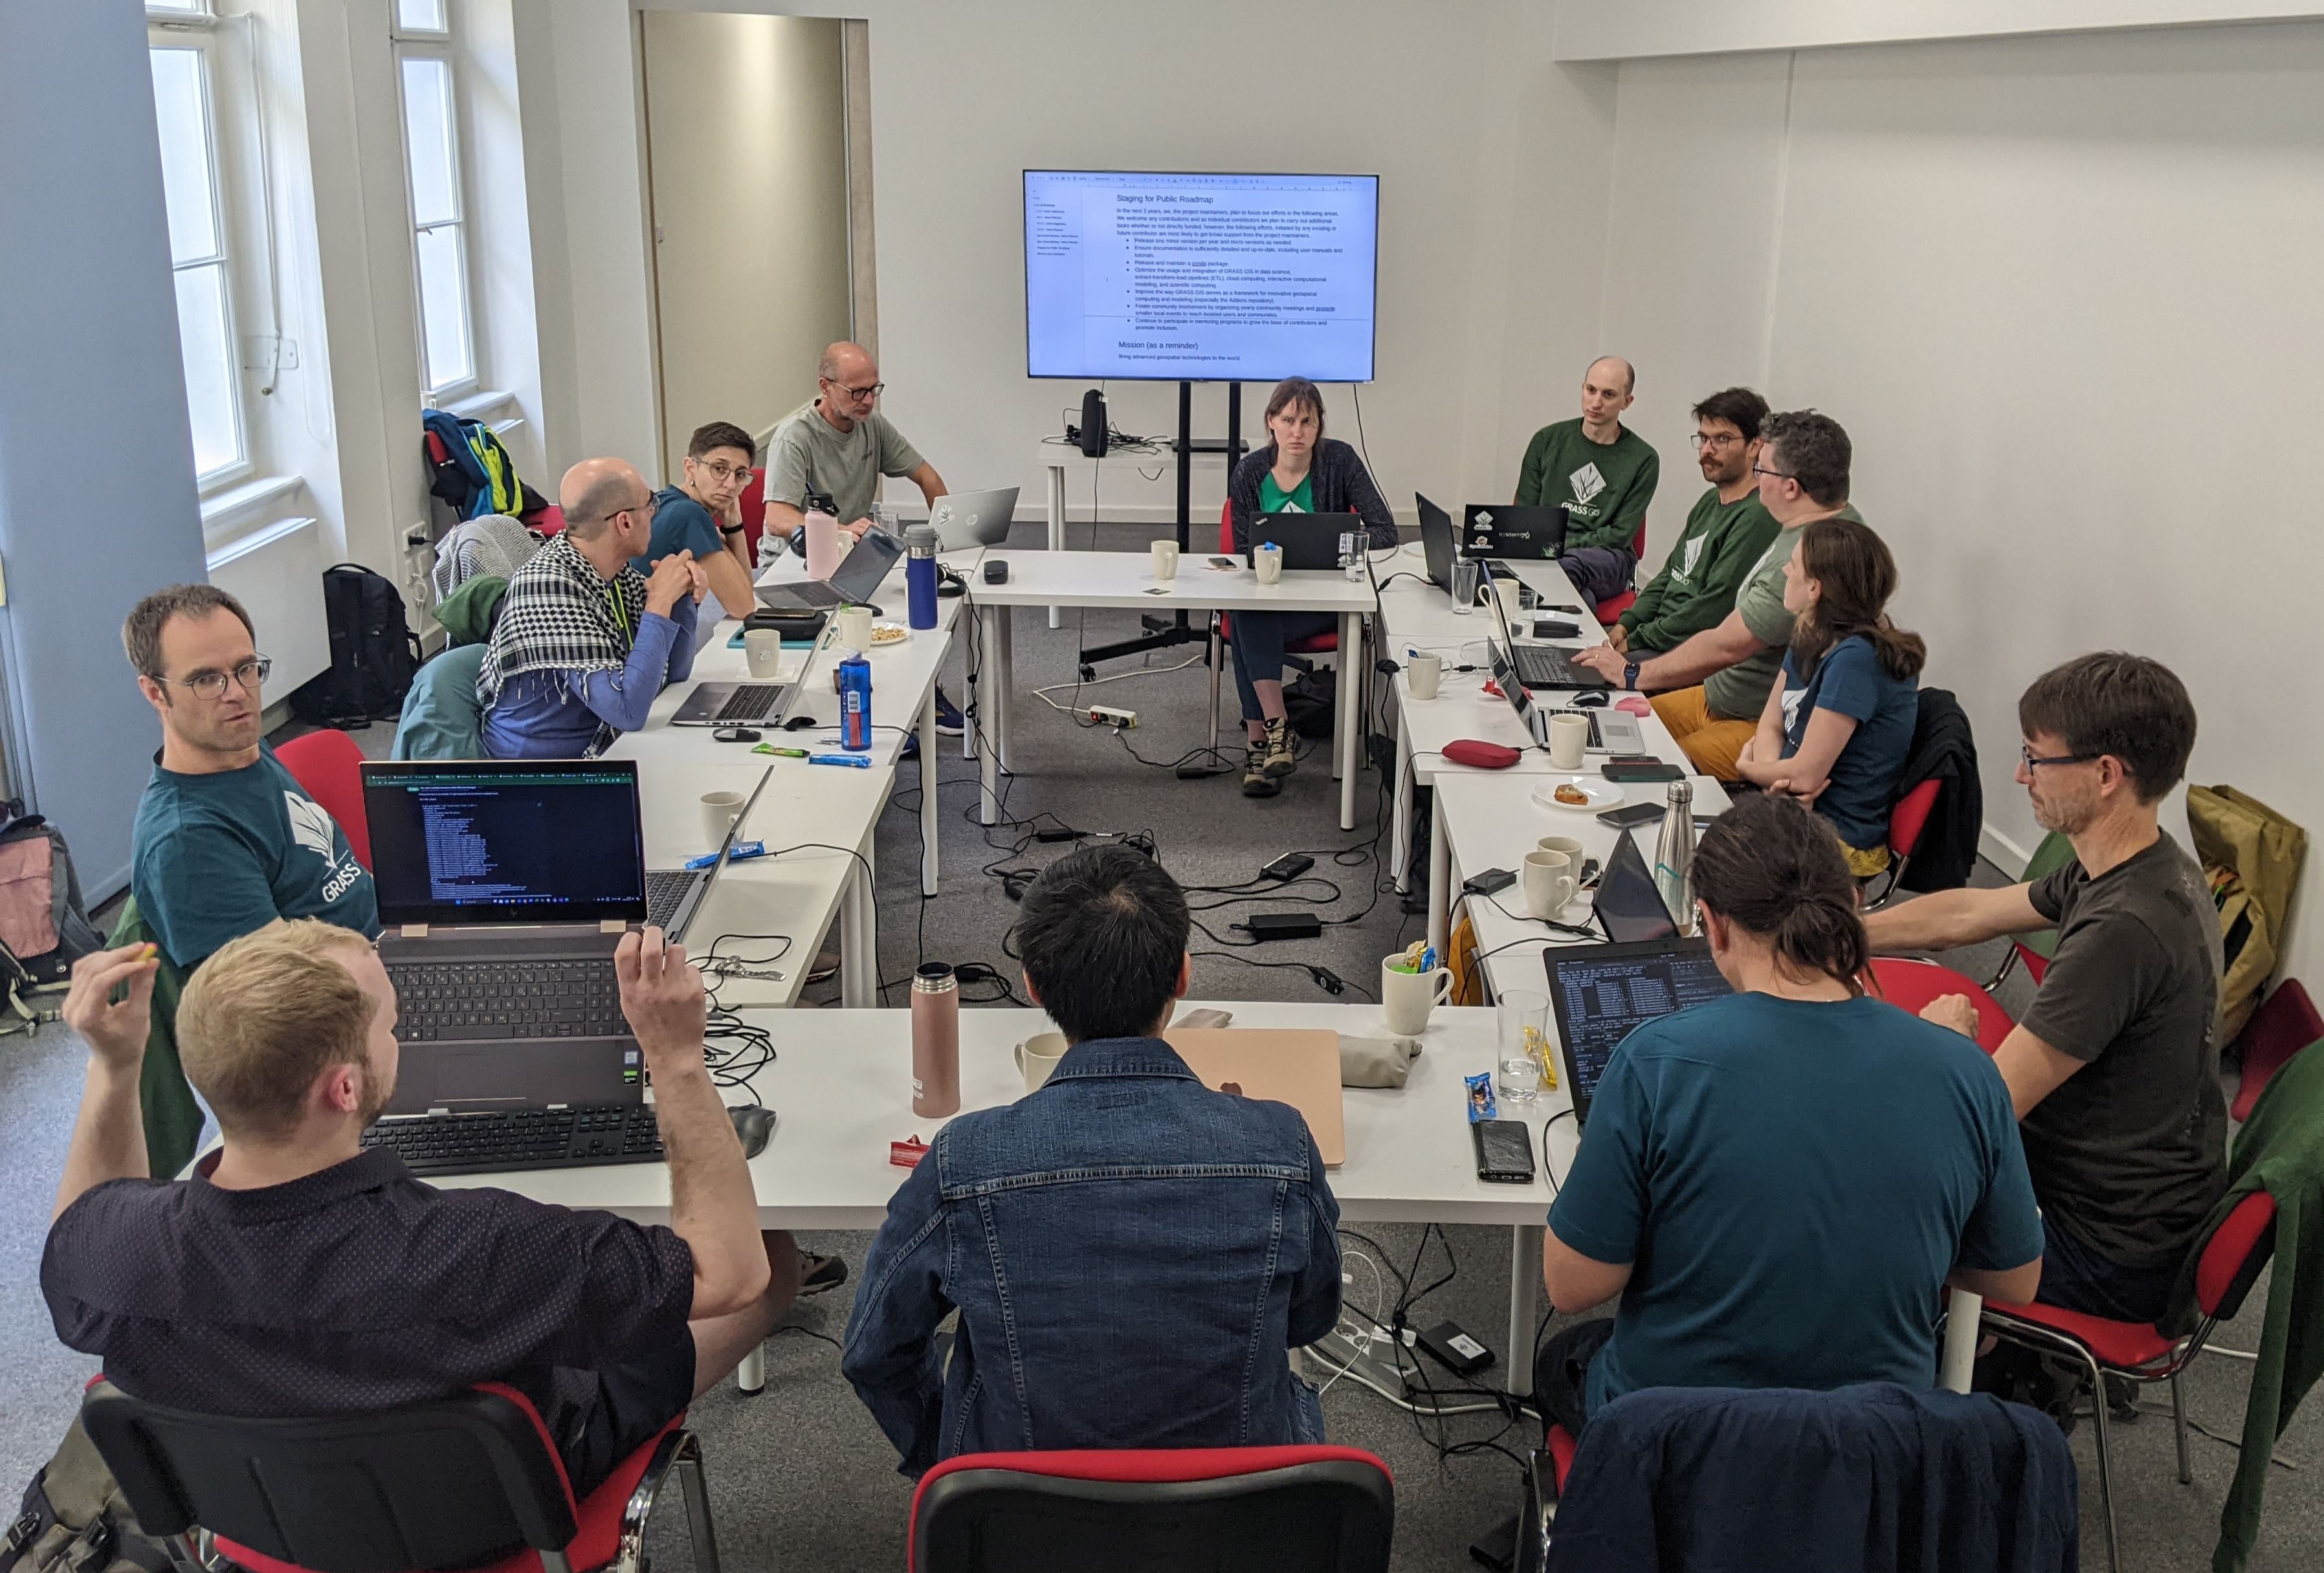
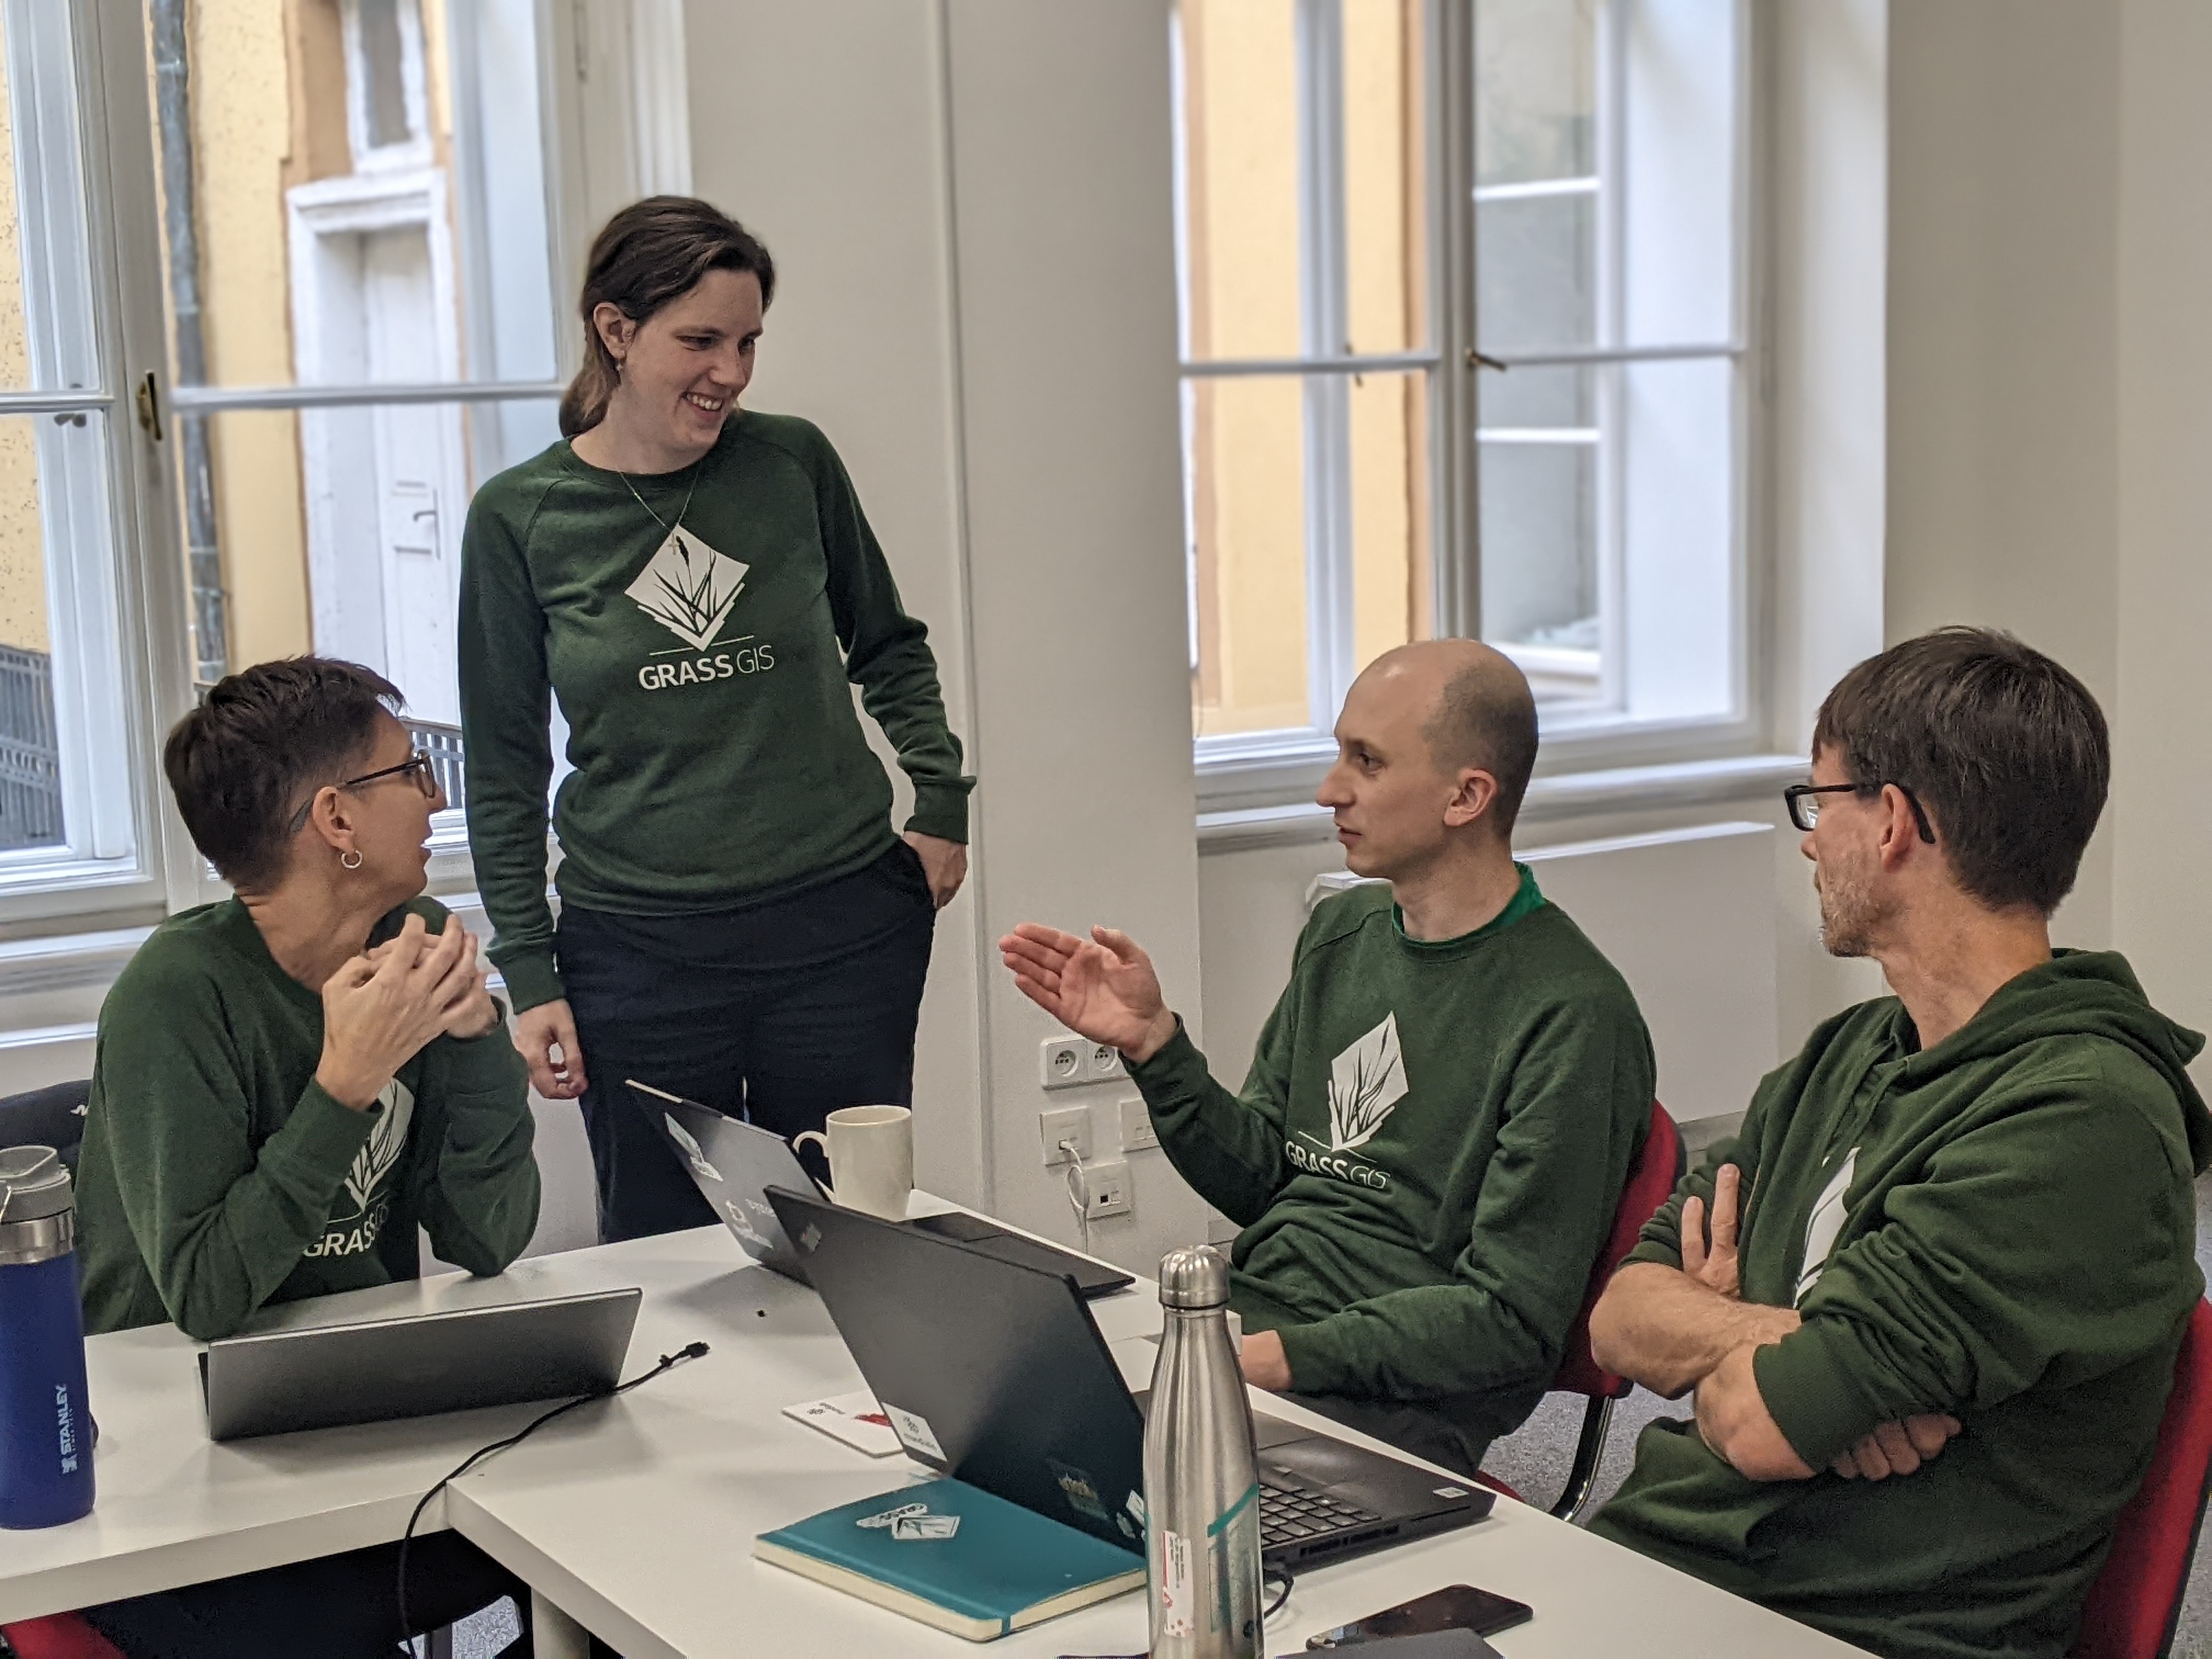
Community Meeting Prague 2024
 Thanks to our sponsors, individual and anonymous contributors!!

Most relevant results from the community meeting
- Released GRASS 8.4. RC1
- Parallelization of more tools: v.surf.rst, r.texture and r.horizon
- Extensive improvements and testing of upcoming tools: t.stac toolset, v.ppa
- GRASS-QGIS integration: it has even come to bug fixing during the call, see the minutes
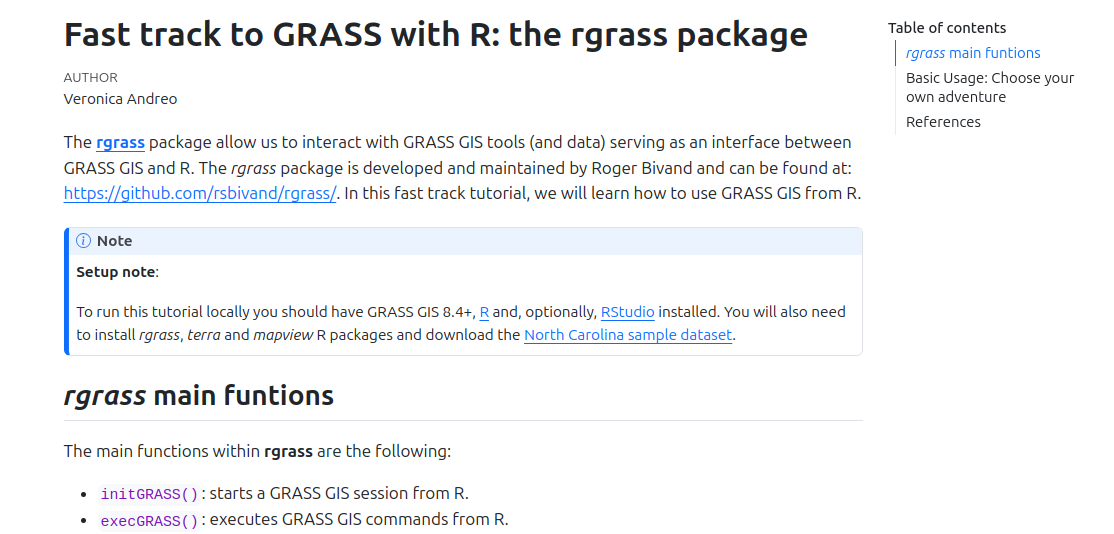
- GRASS-R integration: directly read GRASS data through the gdal-grass plugin
- Advanced in the conversion of manual pages to Markdown
- Lots of CI improvements, issues and PRs cleanup, discussions, documenting procedures
- Nix distribution, new tutorials...
Governance
- PSC elections by mid October 2024. Get your OSGeo-ID ready for voting
- Formalized our project mission and roadmap
- Formalized releases, language support and standards, and security procedures
- Formalized contribution procedures: PR requires a positive review from someone with write access to be merged
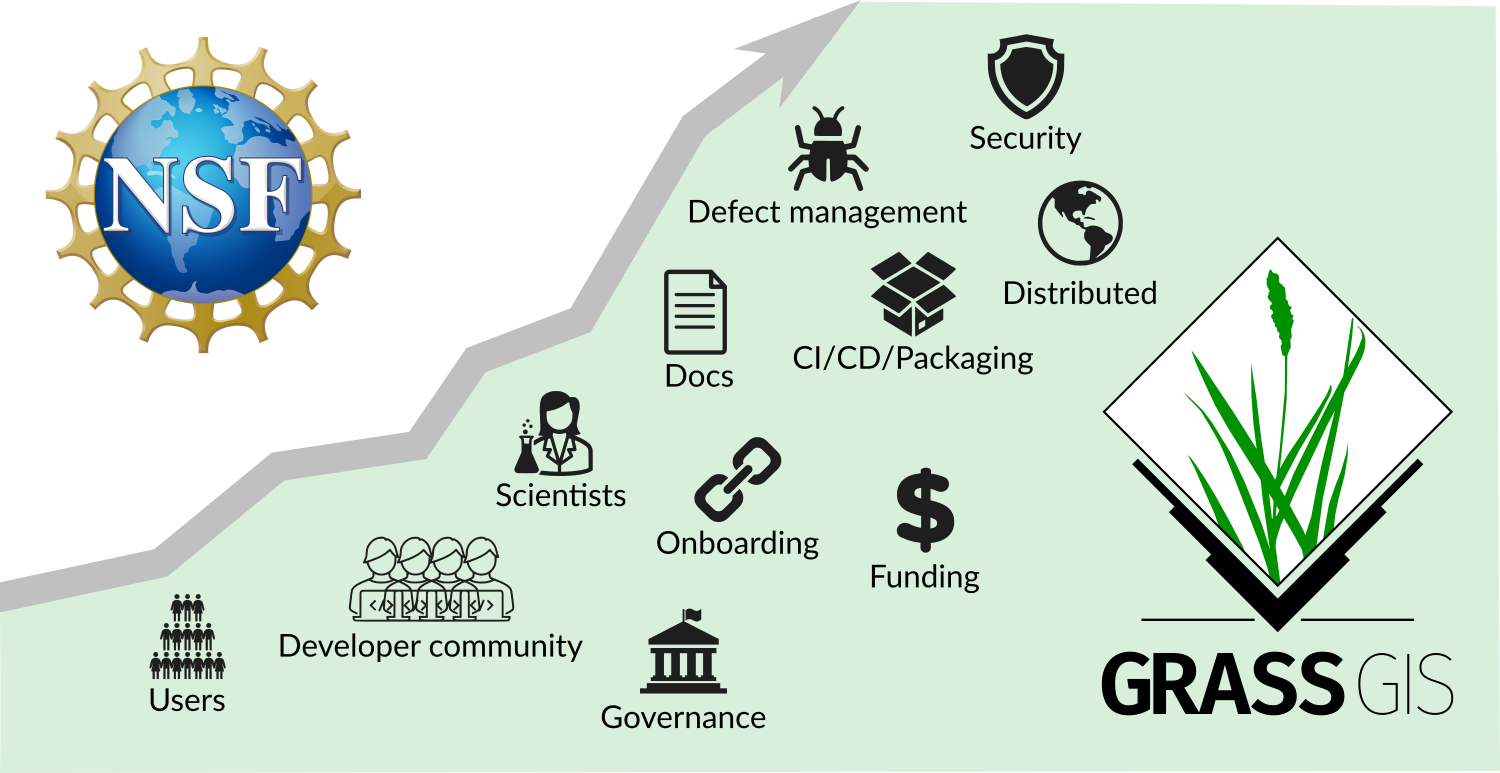
Funding
NSF grant lead by NC State
- NSF grant awarded to NC State, ASU, NMSU, Yale
- to enhance infrastructure
- to revise contributing guidelines
- to support community building
Note: The NSF program is aiming at sustainability, not adding features, fixing bugs, or ongoing maintenance.
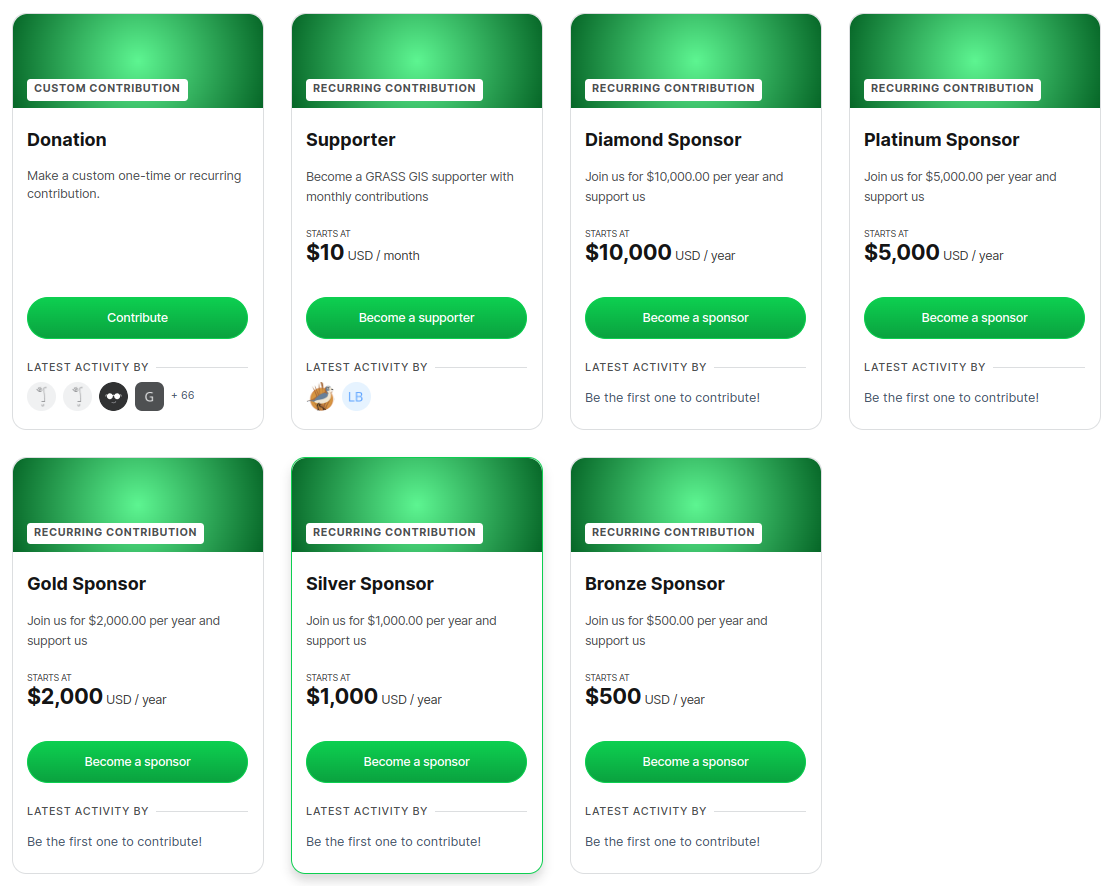
Funding Options on OpenCollective
- Donation (one-time, any amount), Supporter starts at 10 USD/month, Sponsor starts at 500 USD/year
- Feedback? Talk to me about being part of the solution!

Get involved!
All contributions are welcome!
Code and doc contributions
- Fork the repo and suggest your code or doc changes via pull requests in grass core, grass-addons, or grass-website repositories
- File bug reports or feature requests
- Ask, comment, suggest also in Github Discussions
- Create your own GRASS tool! Now much easier with the cookiecutter template
- Have a look at the new Style guide

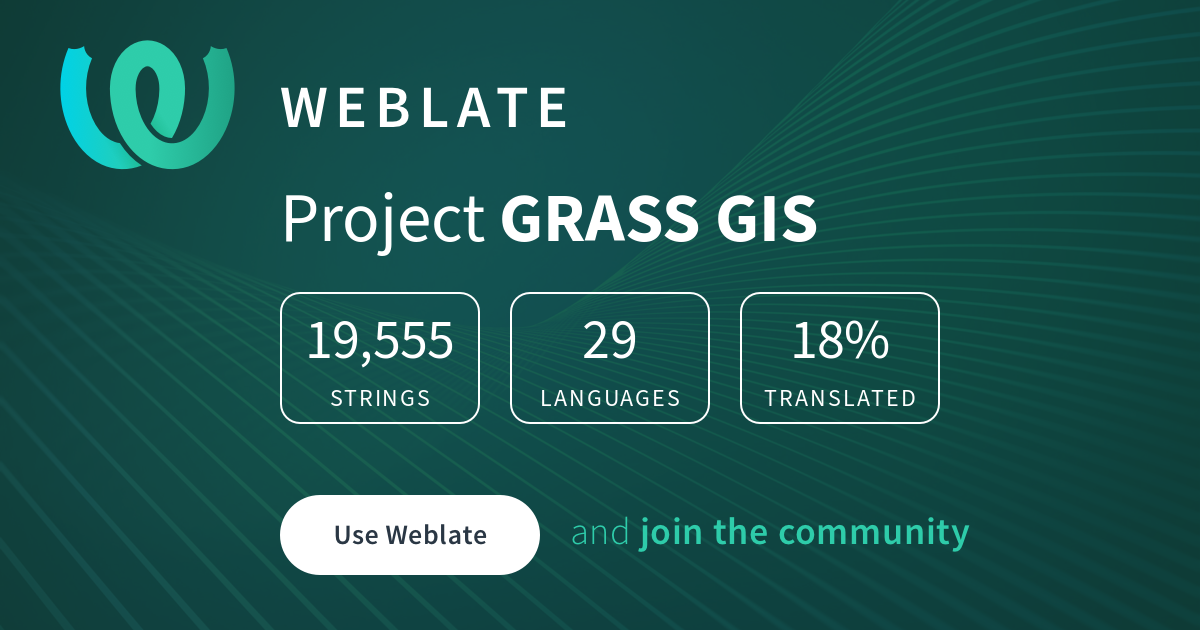
Translations in Weblate
Use cases and tutorials
- Write tutorials for different applications or showcase your GRASS use cases
- Currently collecting them at: ncsu-geoforall-lab/tutorials
 Do you have a GRASS GIS use case you want to showcase? Talk to me later
Sponsoring
- Money donations allow us to:
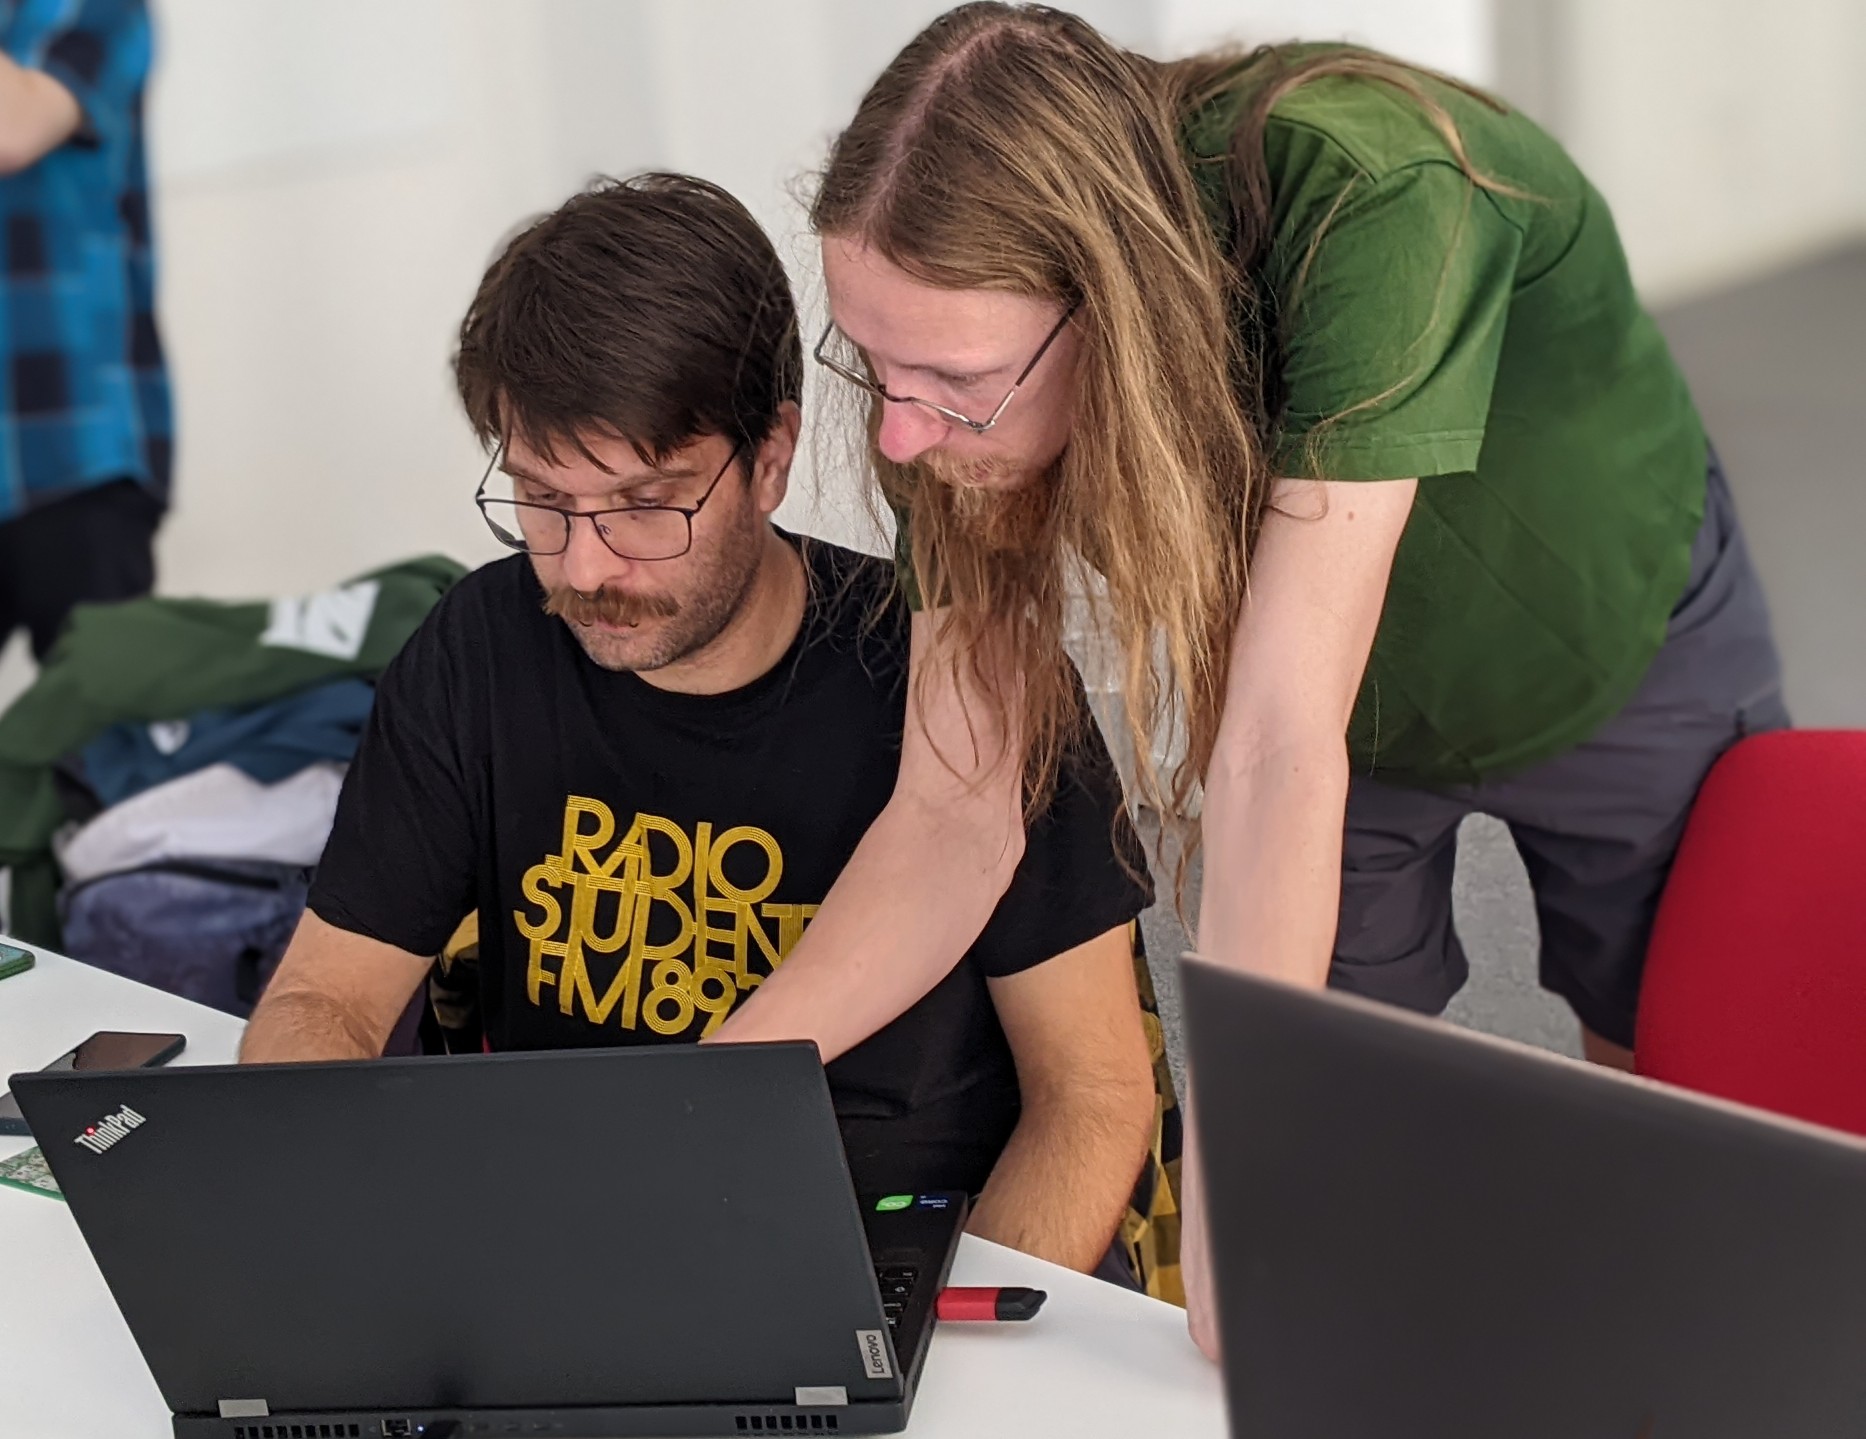
- organize face-to-face coding sessions (sprints)
- support mentoring programs and student grants
- finance infrastucture needs (web site, etc)
Get in touch with us!
grass.osgeo.org
Ask a question, get a special sticker
veroandreo@gmail.com
veroandreo.github.io/grass-gis-talks
Funded by NSF award 2303651